
FIGURE 4.
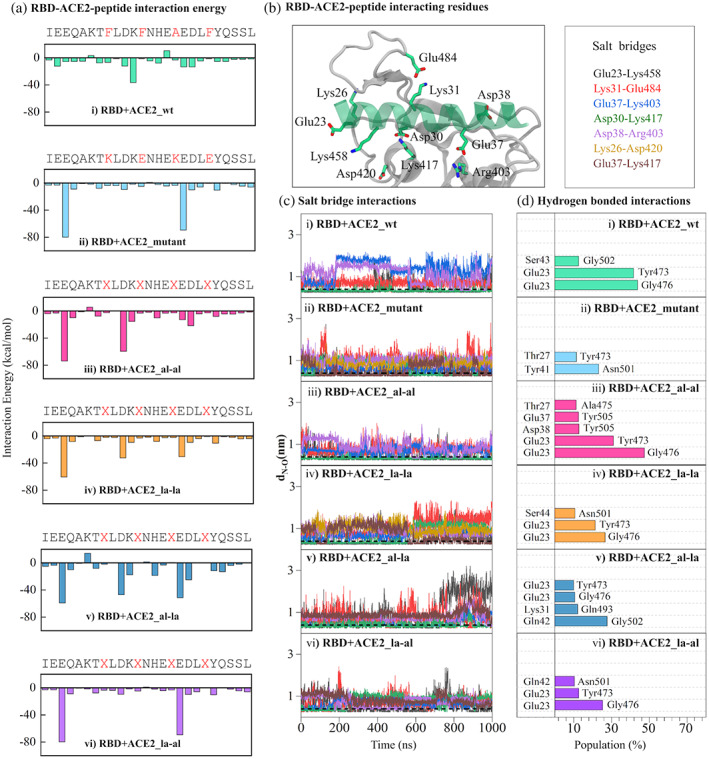
RBD‐ACE2 interactions: (a) the average interaction energy (as a sum of electrostatic and van der Waals energy) of each ACE2‐peptide residue with the binding pocket residues of RBD. The residues mutated or replaced by stapling agents are shown in red in the ACE2 sequence. (b) The amino acids of ACE2 (green transparent ribbon) and RBD (white ribbon) involved in salt‐bridge interaction are shown in stick representation. The carbon, nitrogen, and oxygen atoms are colored green, blue, and red respectively. The residue pairs forming effective salt‐bridge interaction are listed in the box on right. (c) the distances (dN—O) between any of the oxygen atoms of Glu/Asp with the nitrogen atom of respective Lys/Arg for the salt‐bridge pairs listed in (B) are plotted for different systems. The horizontal black dotted line at dN—O = 0.4 nm represents the cutoff for effective salt‐bridge formation. (d) the populations of hydrogen bonds formed between ACE2 and RBD residues are shown for different systems. The population is calculated as the percentage of simulation time the pairs form a successful hydrogen bond