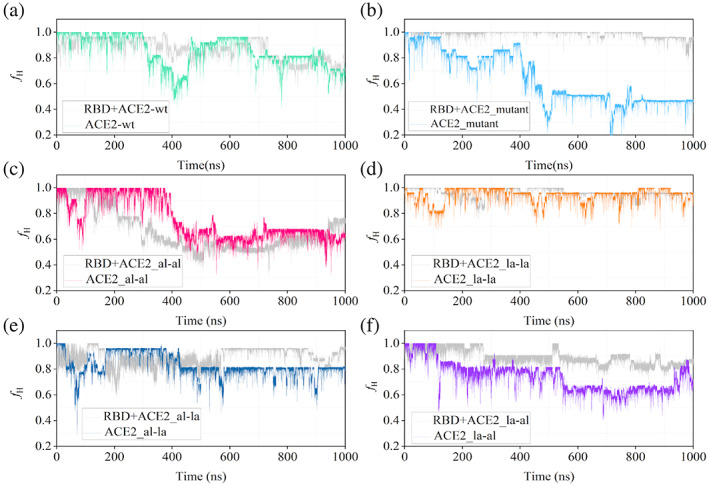
FIGURE 6.

Comparison of time evolution of the helical fraction (f H ) of all ACE2 peptide variants in their free state (represented by their respective color codes same as in figure 5) and in complex with the receptor‐binding domain (RBD) the helical fraction of the RBD‐bound state is shown in gray in all the plots
