Figure 1.

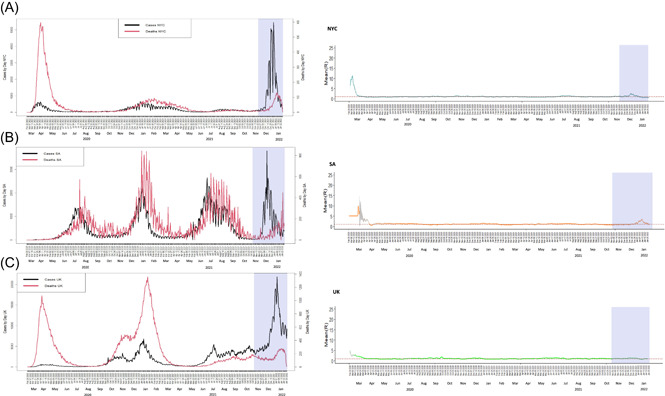
Number of cases (black line) and deaths (red line) reported over time from the start of the pandemic (first case reported in each geographical region) to January 28, in (A) New York, (B) South Africa, and (C) United Kingdom. For each case, the shaded region represents the time from the first case of the Omicron variant reported in GISAID to the cut‐off date (January 28). For the same period, we performed an evaluation to quantify transmissibility throughout an epidemic from the analysis of time series of incidence, as described in Cori et al. (2013), using Epiestim Package (WHO model). Results of modeling of R t were plotted to each case, (A‐NYC) New York, (B‐SA) South Africa, and (C‐UK) UK. For each case, the shaded region represents the time period from the first case of the Omicron variant reported in GISAID to the cut‐off date (January 28)
