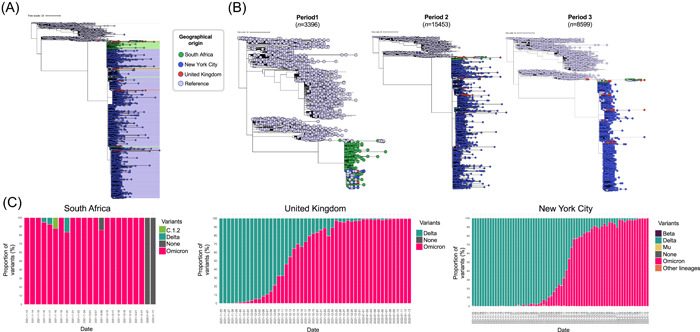
Figure 2.

Phylogenomic relationships and temporal distribution of variants sequences in South Africa, United Kingdom and New York City. (A) Phylogenetic analysis of the Omicron variant sequences from South Africa (SA), United Kingdom (UK), and New York City (NY). A dataset with 22 745 Omicron genomes (from November 5 until January 28), consisting in 306 from UK (red dots), 1394 from SA (green dots), 18 680 from NY (blue dots) and 2365 reference genomes of other SARS‐CoV‐2 lineages (light blue) were used. (B) Temporal phylogenetic analysis of the Omicron variant sequences from SA, UK, and NY. Temporal comparison of Omicron genomes in three periods, Period 1 (n = 1031, November 5–December 3), Period 2 (n = 13 088, December 4–31), and Period 3 (n = 6234, January 3–28). (C) Proportion of SARS‐CoV‐2 variants in SA, UK, and NY
