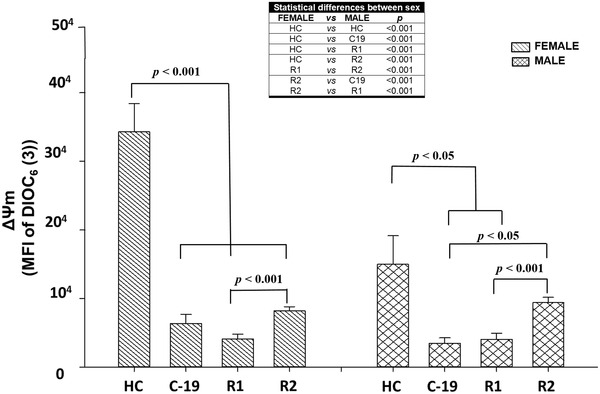
FIGURE 3.

Mitochondrial membrane potential (MFI of DIOC6(3)) of HPBMC from healthy controls (HC), subjects, patients with COVID‐19 (C‐19), subjects recently recovered from COVID‐19 (R1) at 40 ± 13 days after infection (dai) and recovered subjects at 11 months postinfection (R2, at 335 ± 20 dai). MFI was represented as a bar graph with the means ± sem. The table shows the statistically significant differences between male and female. Nonparametric Kruskal–Wallis and Dunn's multiple comparison tests were performed
