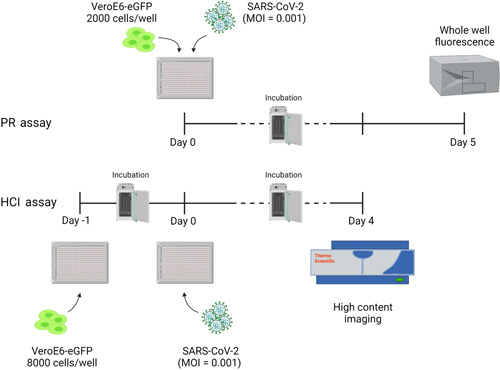
Figure 1.

Schematic overview of PR and HCI assays using prespotted 384‐well plates with compounds in a dose–response curve format at a final starting concentration ranging from 100 to 25 µM. PR assay (top): 2000 cells/well were seeded on Day 0 and infected on the same day, after which a PR readout was performed on Day 5. HCI assay (bottom): 8000 cells/well were seeded on Day –1 and infection with SARS‐CoV‐2 was performed on Day 0, after which an HCI readout was performed on Day 4. Plates were incubated at 37°C and 5% CO2 between days. This figure was made in BioRender. eGFP, enhanced green fluorescent protein; HCI, high content imaging; MOI, the multiplicity of infection; PR, plate reader; SARS‐CoV‐2, severe acute respiratory syndrome coronavirus 2; VeroE6‐eGFP, VeroE6 African green monkey kidney epithelial cells expressing a stable enhanced green fluorescent protein
