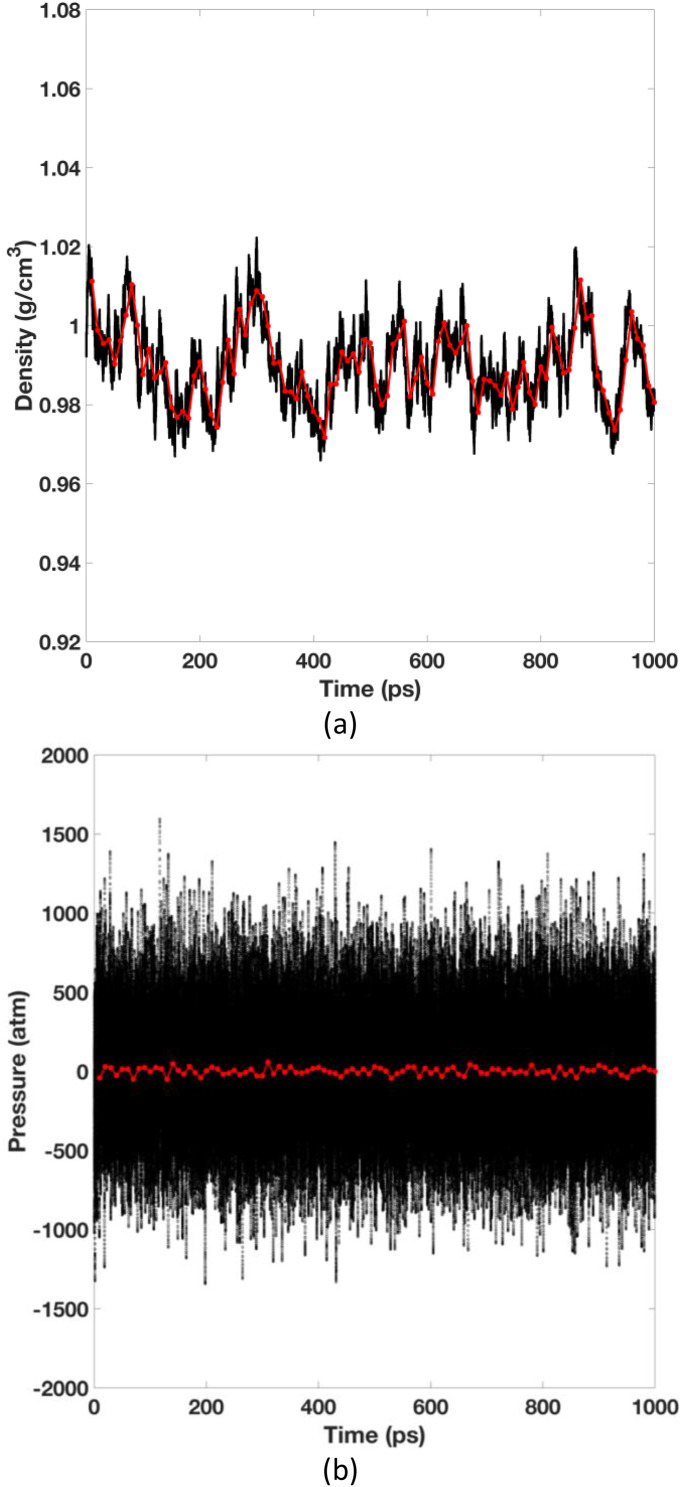
FIG. 2.
Time evolutions of density and pressure of the NPT simulation for the 512-water box. The red lines are the running averages of every 10 ps. The time evolutions of total energy and temperature are available in the supplementary material. The time evolutions of density, total energy, and temperature of the Monte Carlo pressure-regulated simulation are also available in the supplementary material.

