. 2018 Oct 23;8(63):36034–36042. doi: 10.1039/c8ra05092a

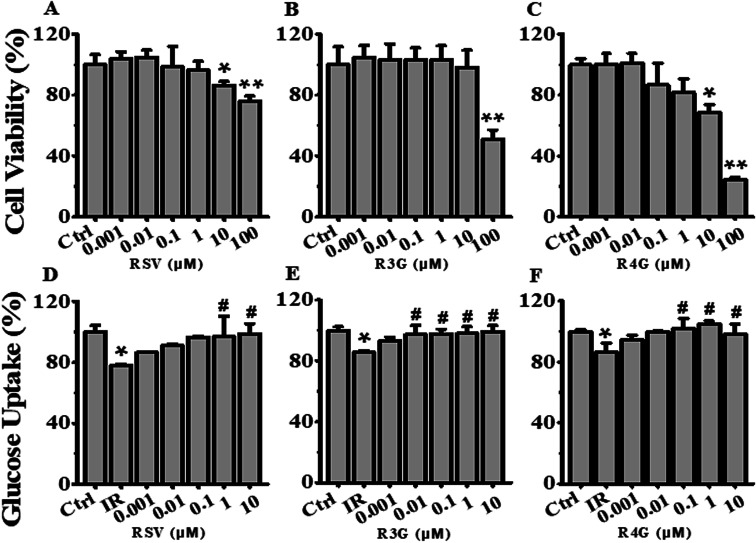
Fig. 3. Effects of different concentrations of RSV, R3G and R4G on cell viability and glucose uptake in HepG2 cells. (A–C) Cells were treated with different concentrations (0.001, 0.01, 0.1, 1, 10 and 100 μM) of RSV, R3G and R4G for 24 h, and then cell viability was assessed and expressed as a percentage relative to the control group. (D–F) Cellular glucose uptake was analyzed in cells first incubated with 1 × 10⁻⁶ mol L−1 insulin for 24 h, then cultured in medium containing different concentrations (0.001, 0.01, 0.1, 1 and 10 μM) of RSV, R3G and R4G for another 24 h. The values represented percentage of control and are means ± SD from three separate determinations. *p < 0.05, **p < 0.01 vs. control cells; #p < 0.05 vs. only insulin-resistant HepG2 cells. IR, insulin resistance; RSV, resveratrol; R3G, resveratrol-3-O-glucuronide; R4G, resveratrol-4-O-glucuronide.

Fig. 3