. 2018 Oct 23;8(63):36034–36042. doi: 10.1039/c8ra05092a

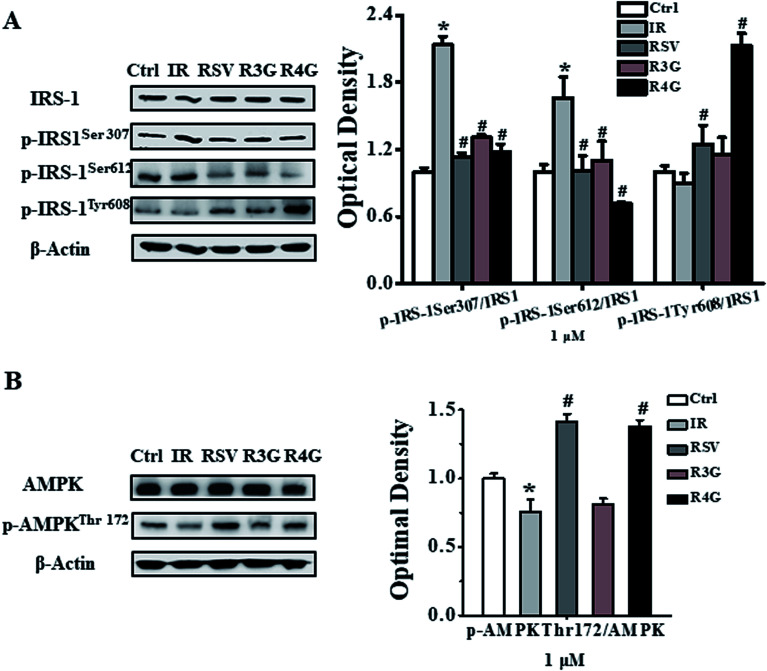
Fig. 5. Effects of RSV, R3G and R4G treatment on IRS-1/AMPK signaling pathway in insulin-resistant HepG2 cells. After cells were incubated with 1 × 10⁻⁶ mol L−1 insulin for 24 h, their media was discarded and was grown in the presence of medium containing 1 μM of RSV, R3G and R4G for another 24 h, respectively. The left side of panel of A showed representative western blot for phosphorylated and total levels of IRS-1, while the right side depicted quantitative analysis of each band. Similarly, left side of panel B showed a representative western blot of phosphorylated and total AMPK levels, and right side depicted quantitative analysis of each band. Values shown are means ± SD from three separate determinations. *p < 0.05; #p < 0.05 vs. only insulin-resistant HepG2 cells.

Fig. 5