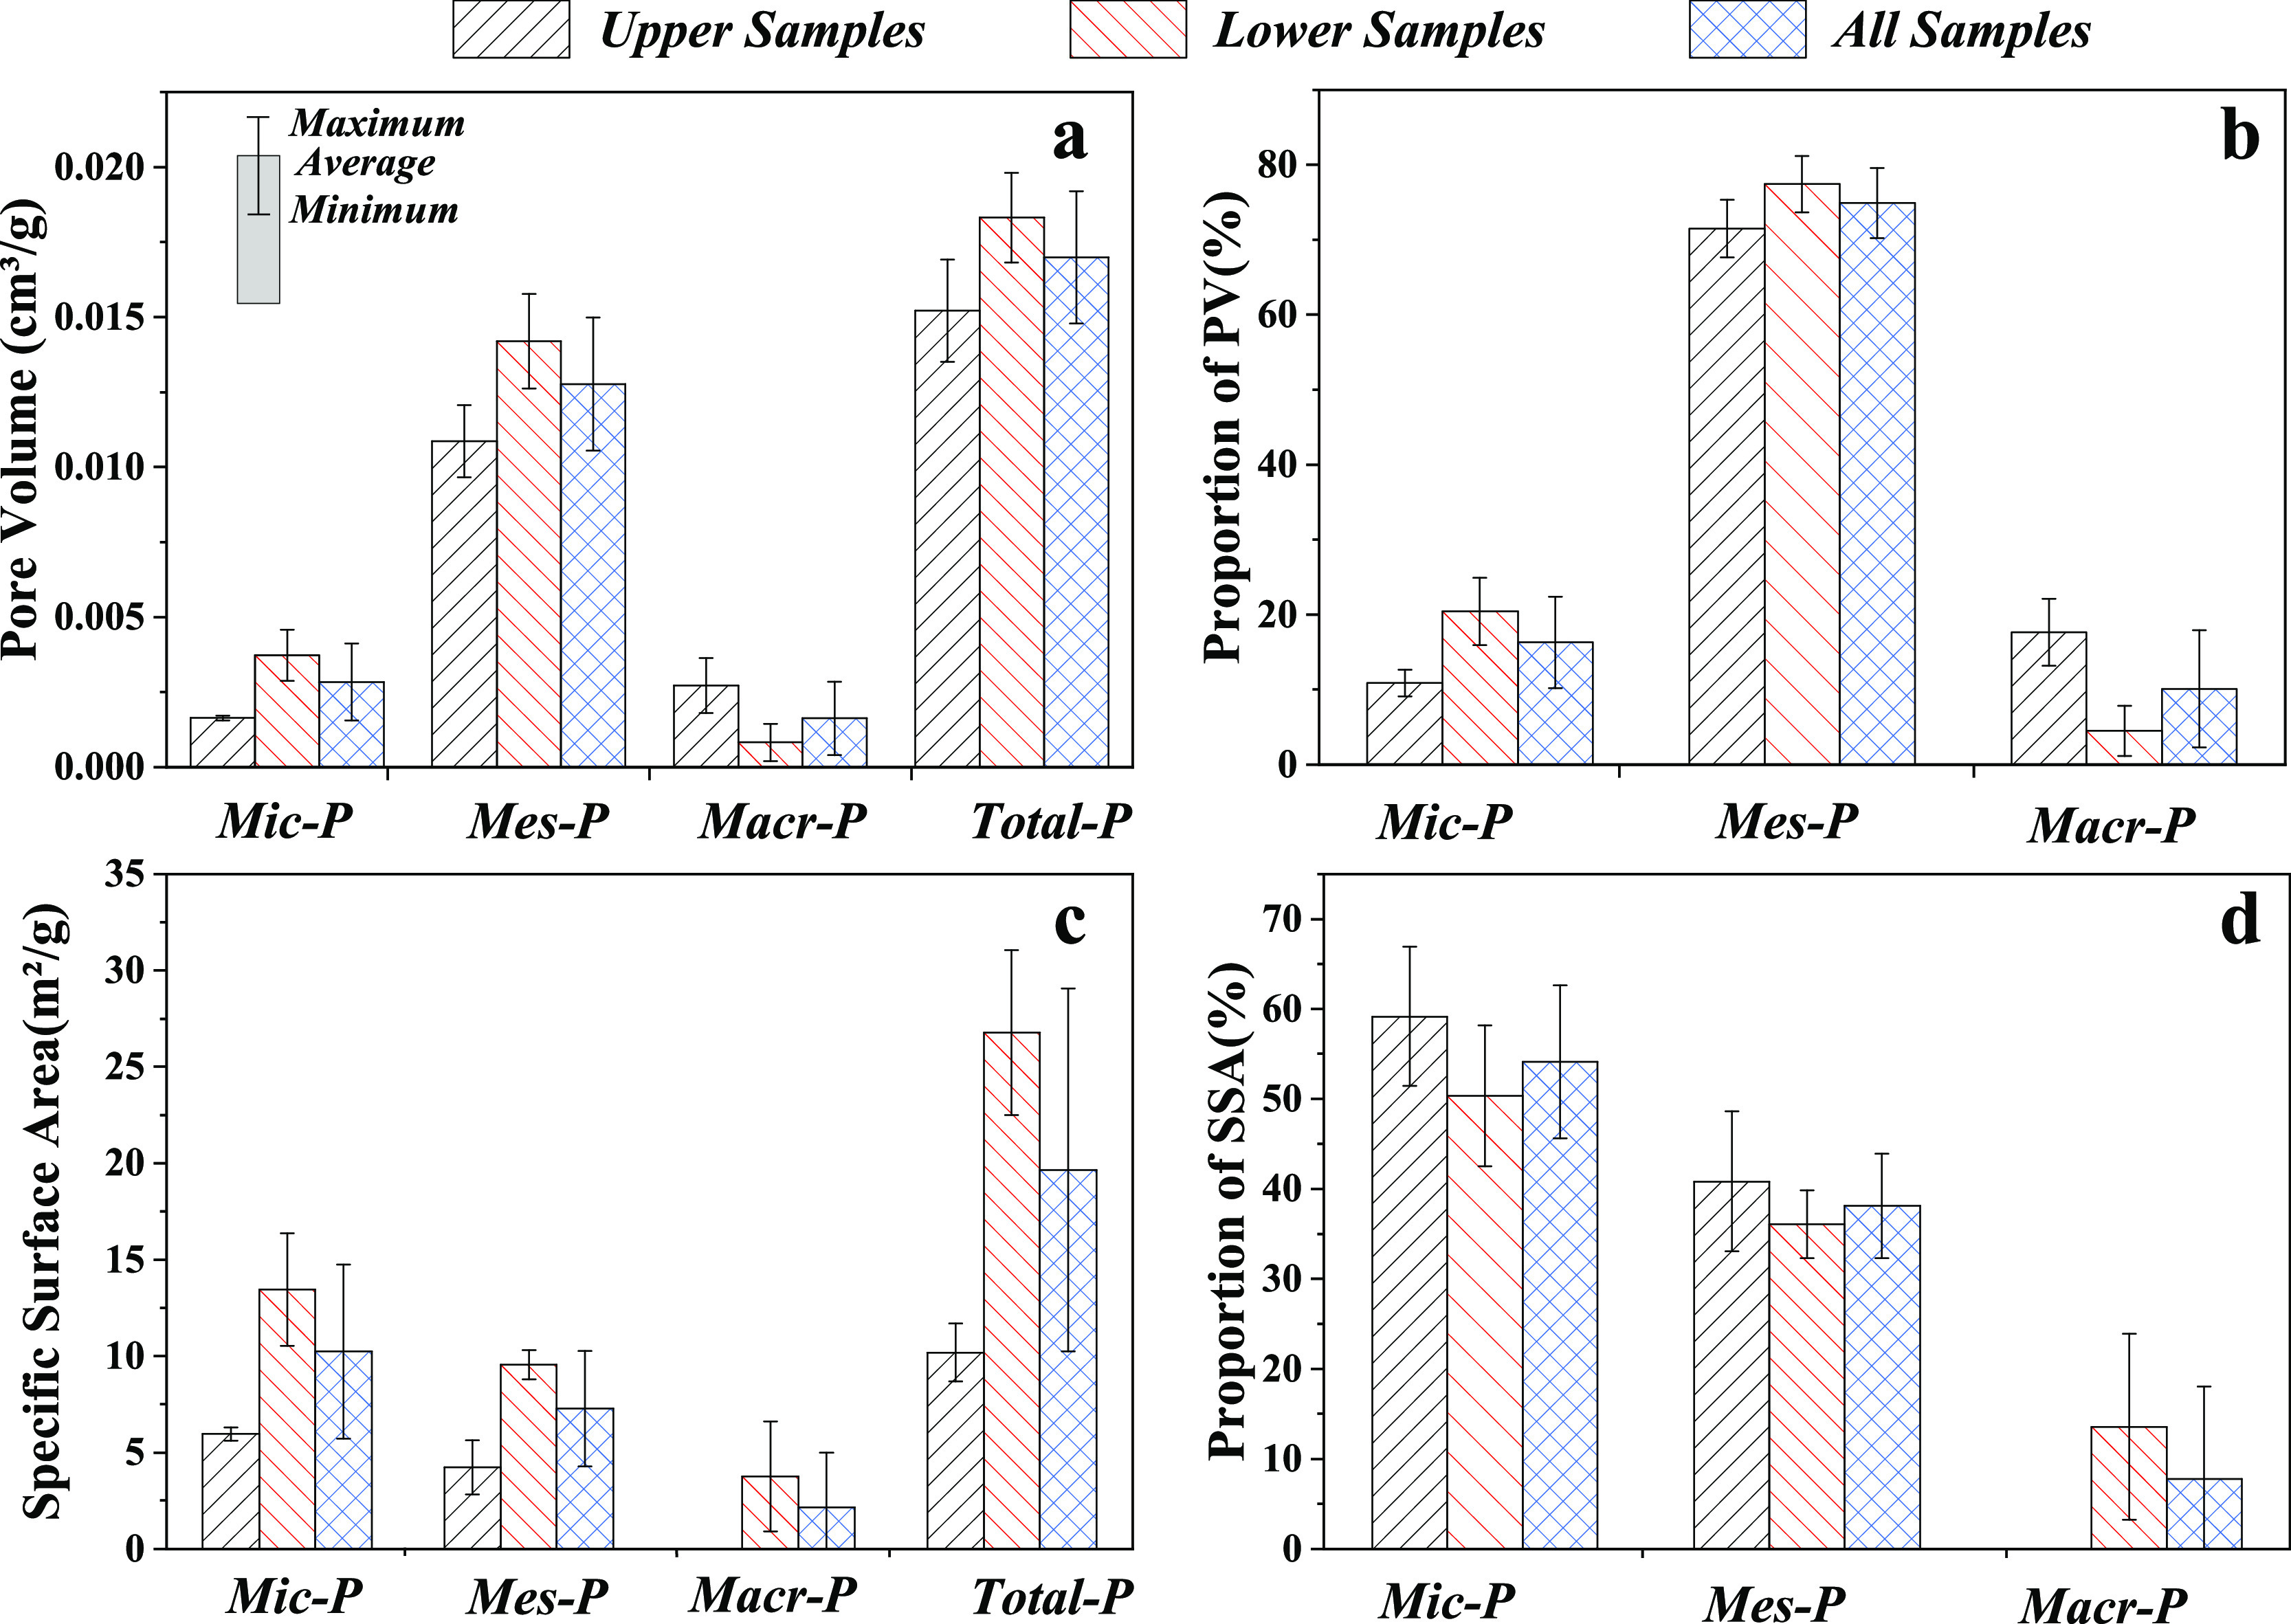
Figure 9.

Data and proportion histogram of PV and SSA of micropores (Mic-P), mesopores (Mes-P), and macropores (Mac-P) in the samples of Upper, Lower, and whole Formation. (a) PV data; (b) PV proportion; (c) SSA data; and (d) SSA proportion.

Data and proportion histogram of PV and SSA of micropores (Mic-P), mesopores (Mes-P), and macropores (Mac-P) in the samples of Upper, Lower, and whole Formation. (a) PV data; (b) PV proportion; (c) SSA data; and (d) SSA proportion.