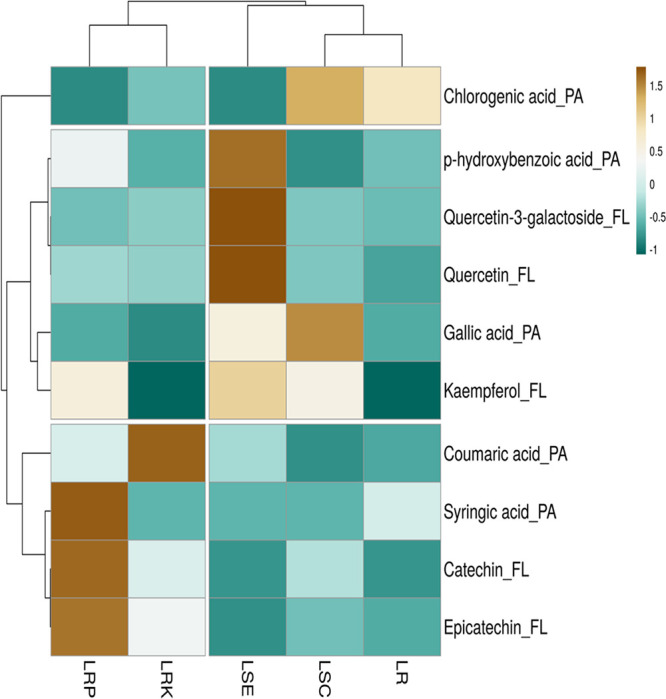
Figure 1.

Heat map showing the distribution and concentration of phenolic compounds in five parts of lotus. Brown boxes show that constructions are higher among five samples. Blue boxes indicate lower concentrations. FL: flavonoids and PA: phenolic acids. Fruit peel samples are mentioned in abbreviations. LR: lotus rhizome pulp; LRP, lotus rhizome peel; LRK, lotus rhizome knot; LSC, lotus seed cotyledon; and LSE, lotus seed embryo.
