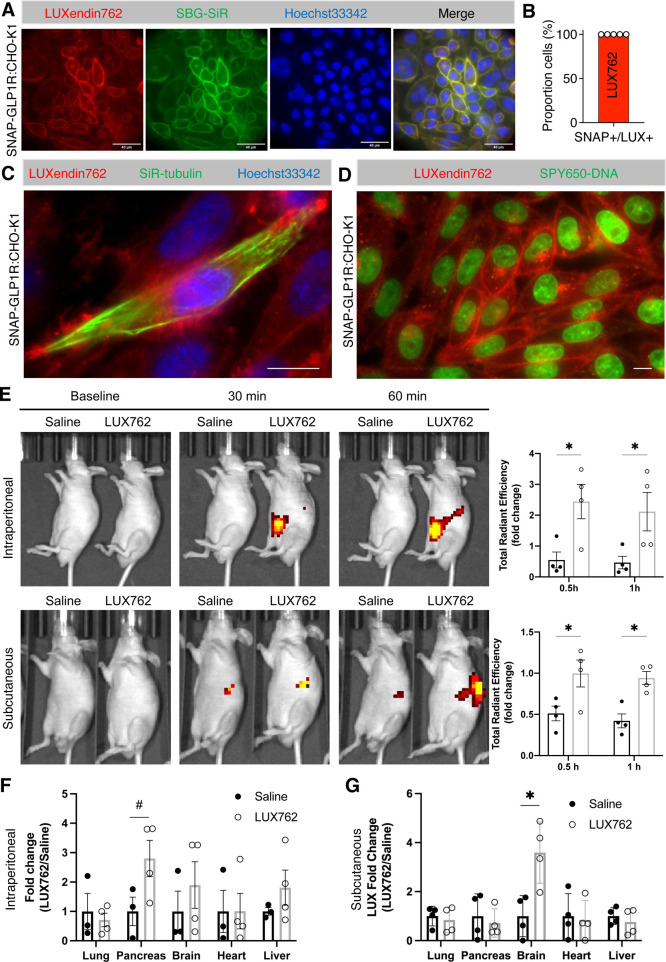
Figure 5.
Evaluation of LUXendin762 distribution in vivo. (A) LUXendin762 (LUX762, 200 nM) labels the membrane of SNAP-GLP1R:CHO-K1 cells (nuclei were stained using Hoechst33342) (scale bar = 40 μm) (n = 3 independent experiments). (B) Labeling efficiency of LUXendin762 in SNAP-GLP1R:CHO-K1 cells (n = 5 wells). (C) LUXendin762 is compatible with far-red SiR-tubulin that labels microtubules of SNAP-GLP1R:CHO-K1 cells (nuclei were stained using Hoechst33342; please note that not all cells were stained by SiR-tubulin) (scale bar = 10 μm). (D) LUXendin762 is compatible with far-red SPY650-DNA that labels nuclei of SNAP-GLP1R:CHO-K1 cells (scale bar = 10 μm). (E) In vivo images of mice intraperitoneally or subcutaneously injected with saline or LUXendin762 at the baseline and 30 min and 1 h post-injection. Data plotted as the fold change of total radiant efficiency signals of the whole body measured at 30 min and 1 h post-injection. (F) Ex vivo analysis of harvested tissues 1 h post-intraperitoneal injection (n = 4 mice). (G) Ex vivo analysis of tissues 1 h post-subcutaneous injection (n = 4 mice). Graphs show mean ± SEM. #p = 0.08, *p < 0.05 (unpaired t-test for each tissue).

