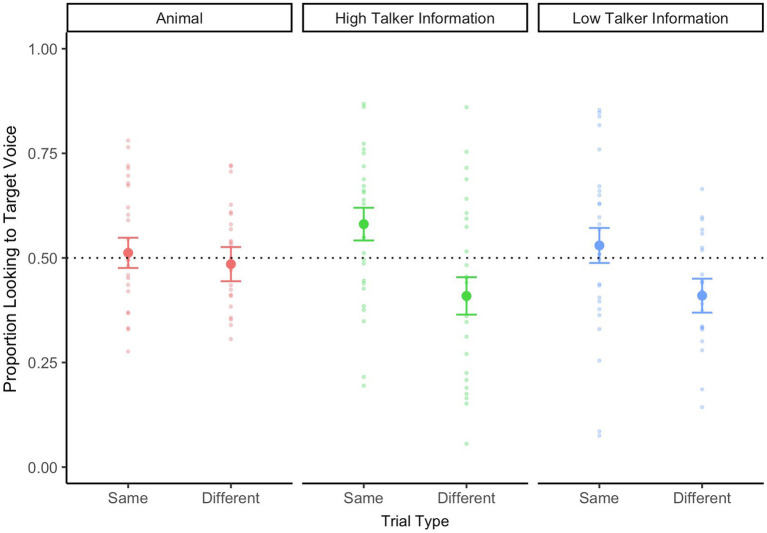
Figure 2.
Twelve-month-old infants’ looking data during the critical WoA in the test phase, separated by trial type (same speaker vs. different speaker) and talker information (high talker vs. low talker). The looking data for animal trials are also represented on this graph. A value above 0.5 represents proportionally longer looking time to the target voice. The dotted line at 0.5 refers to equal proportion looking to both faces on the screen. Errors bars represent standard error.

