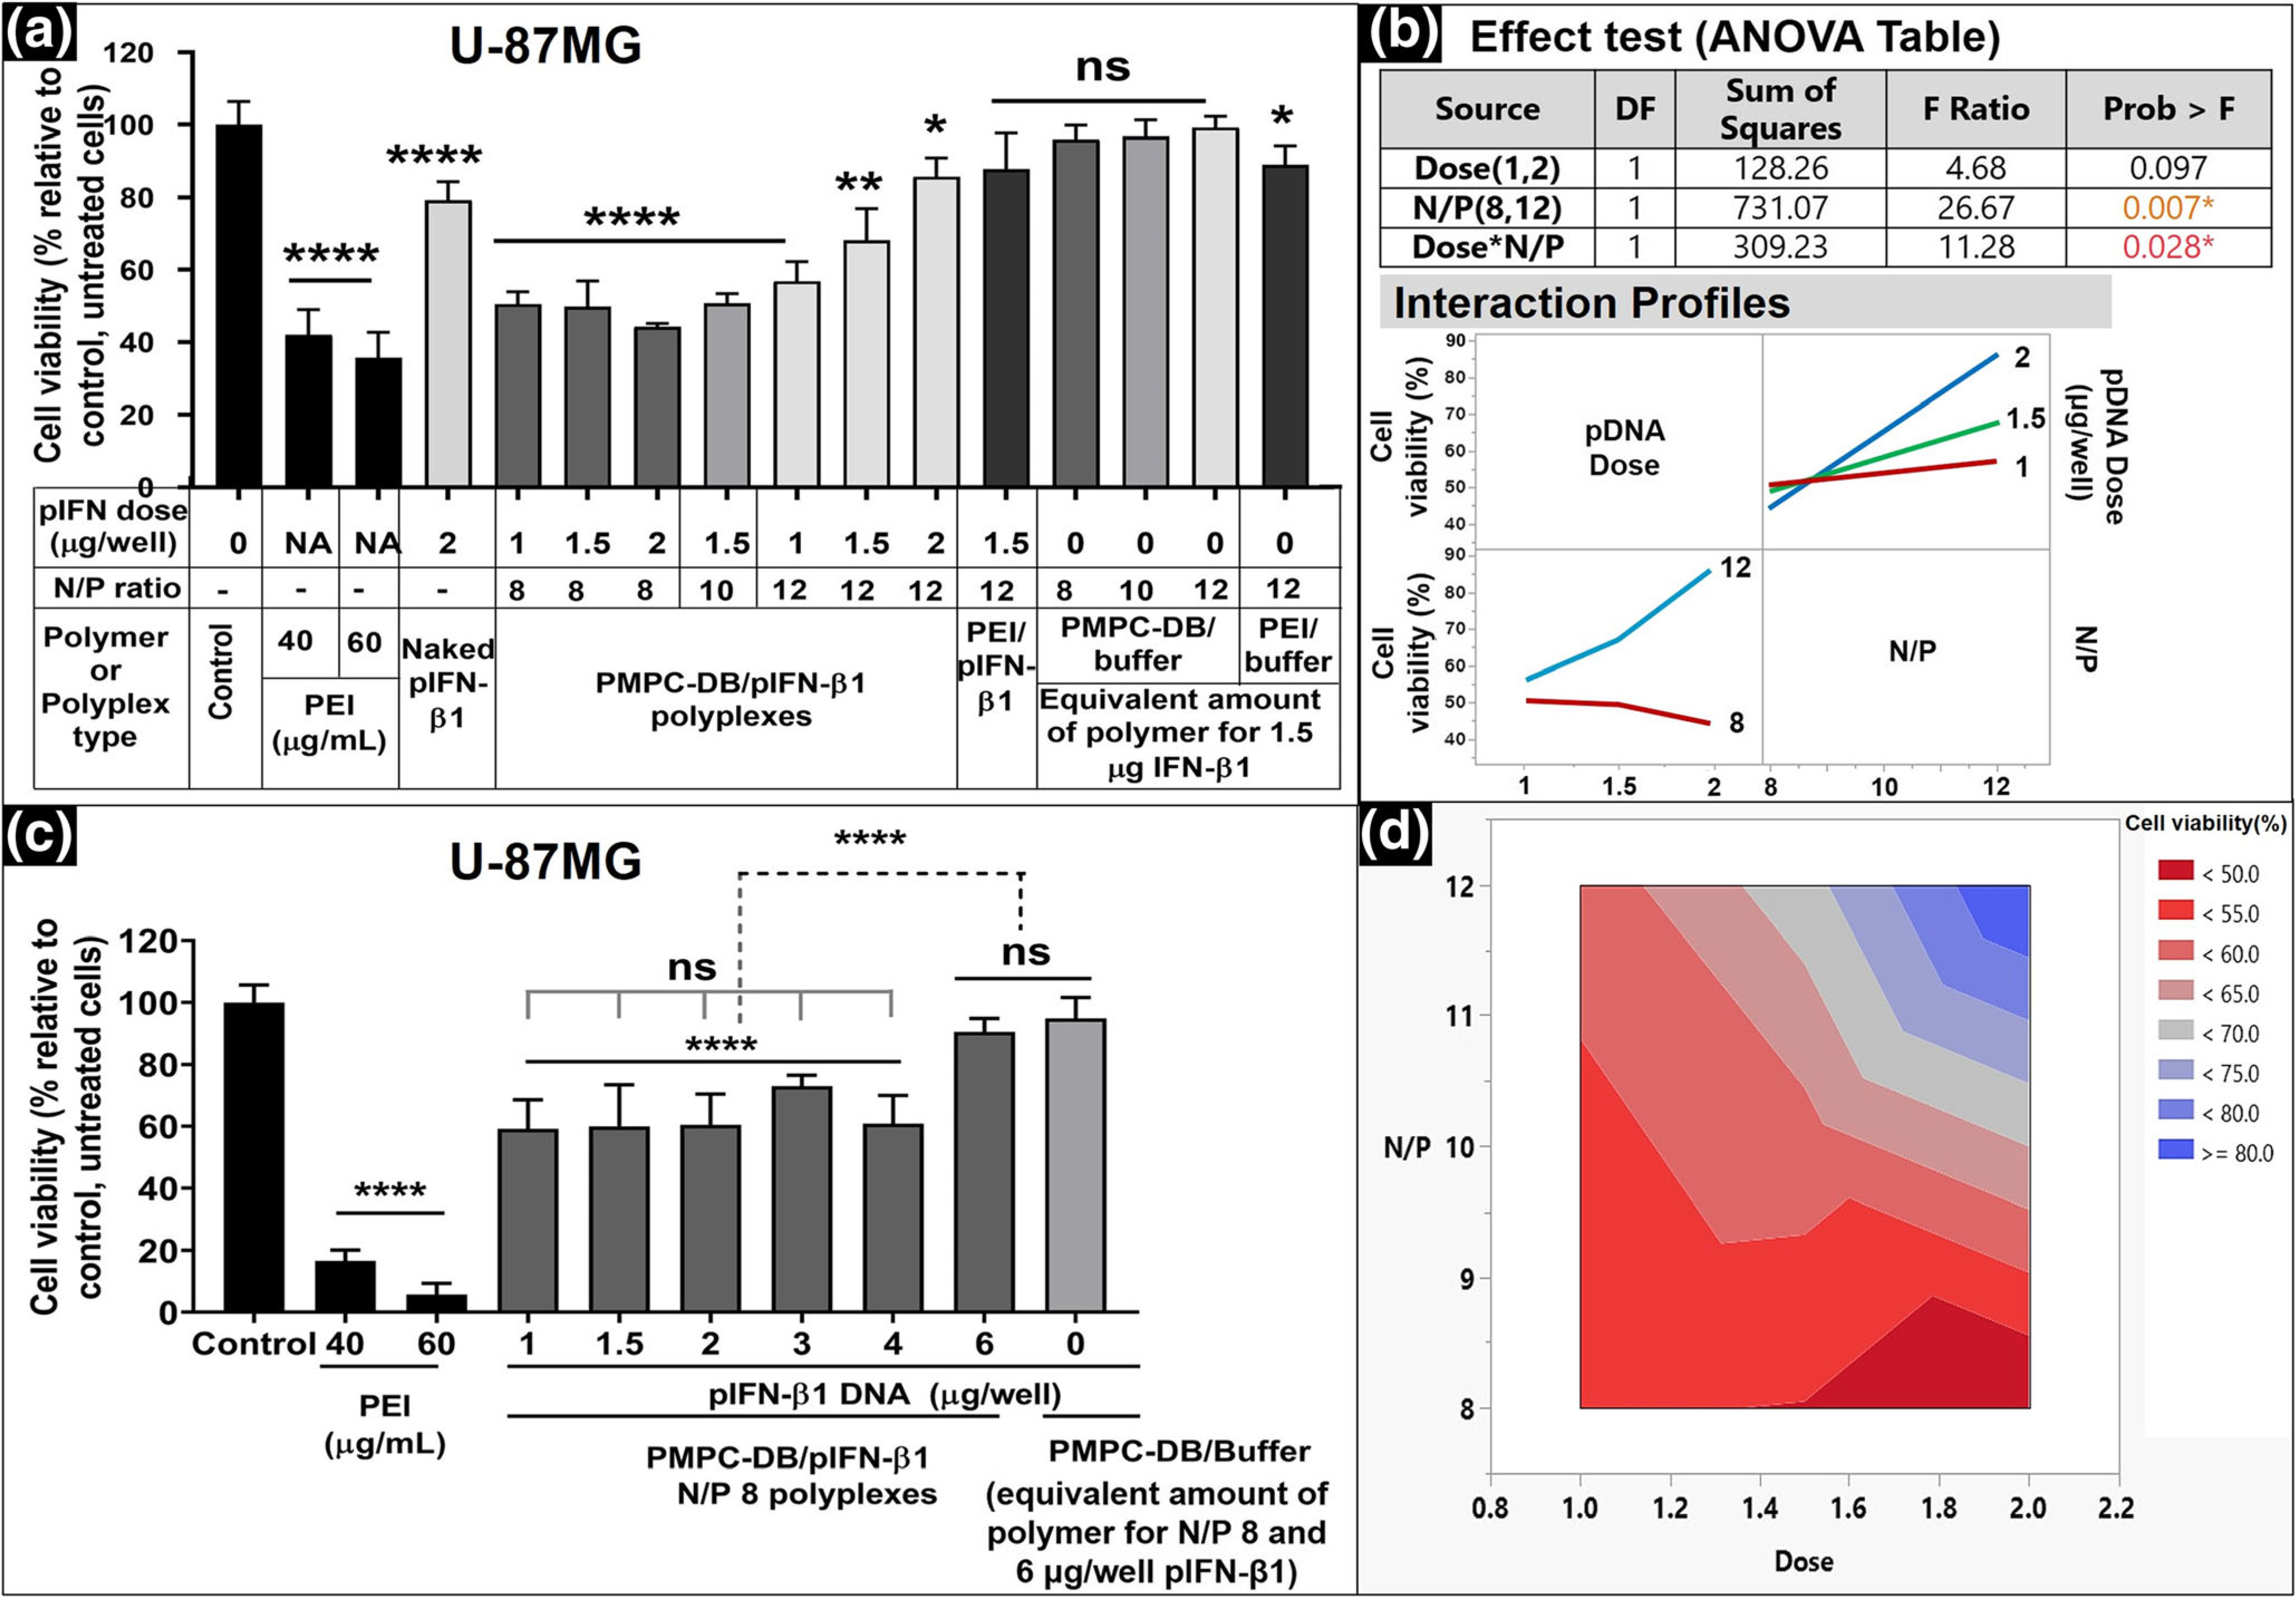
Fig. 5.

Effect of DNA dose and polyplex N/P ratio on the activity of IFN-β1 in U-87MG cells. (a) U-87MG cells were transfected for 4 h with the indicated samples. Naked DNA at 2 μg/well, PEI/IFN-β1 polyplexes at N/P 12, and an equivalent amount of free polymer at each N/P were used as negative controls. PEI at 40 and 60 μg/ml was used as positive controls. Untreated cells were used as the baseline control. The cell viability was measured using the ATP assay 48 h posttransfection, and % relative cell viability was calculated relative to the control. (b) The statistical analysis of the effect of DNA dose and N/P ratios on cell viability was studied using JMP Pro 14 software. The significance of individual factors and their interaction on cell viability was evaluated using the Effect test (ANOVA table). Interaction profiles showed the effect of polyplex N/P ratios on the cell viability at different pDNA doses. (c) The best -performing PMPC-DB/IFN-β1 polyplex composition, N/P 8, that yielded the lowest post-treatment cell survival was evaluated at different DNA doses ranging from 1 to 6 μg/well. The cell viability of U-87MG cells transfected for 4 h with DNA polyplexes was measured at 48 h post-transfection using the ATP assay. (d) The Contour plot for cell viability at different DNA doses and polyplex N/P ratios derived using the JMP Pro 14 software. The gradient map represents the predicted combined effect of the DNA doses and polyplex N/P ratios on % cell viability. Statistical analysis between specified groups in a and c was performed using GraphPad Prism 8.4.1. Asterisks represent statistically significant differences and the significance levels are indicated as *p < 0.05, **p < 0.01, ***p < 0.001, and ****p < 0.0001. Data are presented as mean ± SD of n = 5 samples.
