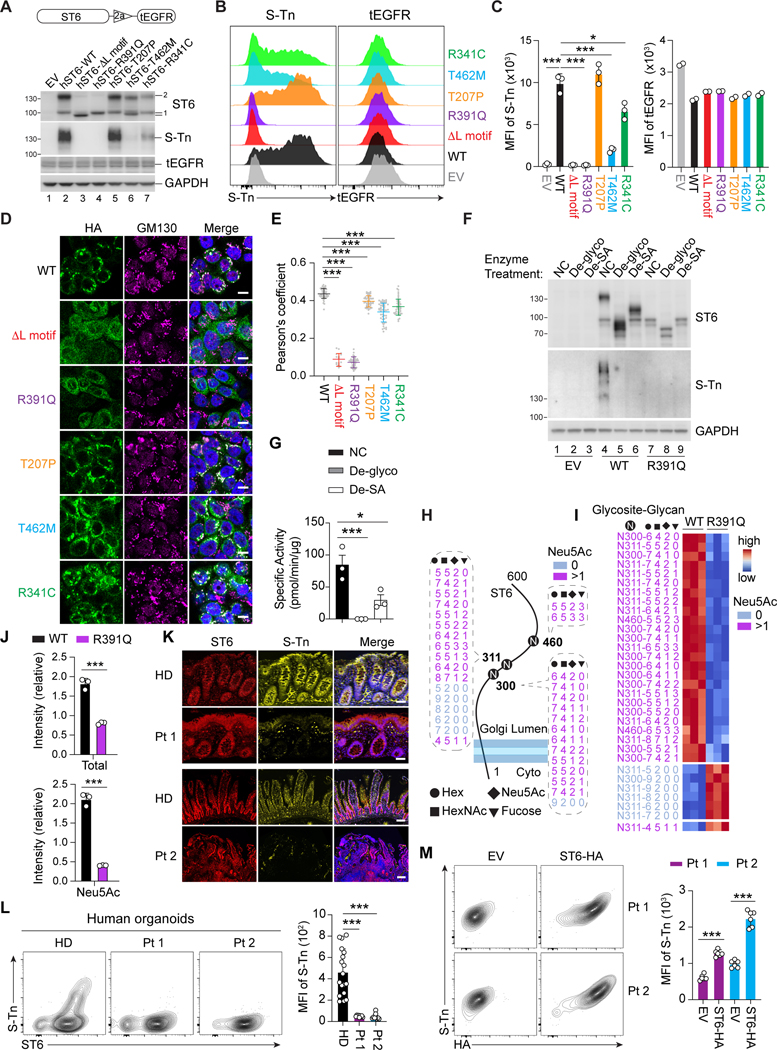
Figure 5. Impaired enzymatic activity of ST6 mutations.
(A) (Top) Lentiviral co-expression vector with truncated Epidermal Growth Factor Receptor (tEGFR). 2a = 2A self-cleaving peptides. (Bottom) Immunoblot analysis of ST6 and Sialyl-Tn (S-Tn) with stable tEGFR lentiviral vector expression of WT and mutant forms of human ST6 (hST6) in HT29 cells. EV = empty vector. tEGFR and GAPDH are transduction and loading controls, respectively.
(B) Flow cytometry analysis of S-Tn and tEGFR in HT29 cells with stable expression of WT and mutant forms of human ST6.
(C) Quantification of S-Tn and tEGFR mean fluorescence intensity (MFI) in (B).
(D) Confocal photomicrographs of HA-tagged WT and ST6 mutants and the Golgi marker GM130 in HT29 cells with stable ST6 expression. Scale bar, 10 μm.
(E) Pearson’s coefficient scores for ST6 and Golgi staining shown visually in (D).
(F)ST6 and S-Tn were detected by immunoblot after deglycosylation enzyme mix (De-glyco) (PNGase F, O-Glycosidase, α2–3,6,8,9 Neuraminidase A, β1-4 Galactosidase S, β-N-acetylhexosaminidasef), or desialylation (De-SA) (α2–3,6,8,9 Neuraminidase A) treatment in HT29 cells with stable ST6-WT and ST6-R391Q expression.
(G) ST6 enzyme activity was quantitated after deglycosylation (De-glyco) and desialylation (De-SA) treatment.
(H) Asparagine (N)-linked glycosylation sites and the modified residues on ST6 in HT29 cells with stable expression of ST6-WT and ST6-R391Q. Glycoforms are shown with their glycan compositions presented as the numbers of Hex, HexNAc, Neu5Ac, and Fucose (dashed). Non-SA (Neu5Ac 0) and SA (Neu5Ac >1)-containing glycoforms are color coded. Cyto = cytoplasm.
(I) Intensity heatmap of the ST6 N-glycoforms as in (H). Color scale shows normalized N-glycoform intensities.
(J) Relative intensity of total or SA (Neu5Ac)-containing N-glycoforms on ST6 from HT29 cells with stable ST6-WT and ST6-R391Q expression.
(K) Immunofluorescent staining of colon biopsies of Pt 1 and HD, and small intestine of Pt 2 and HD showing S-Tn and ST6. Scale bar, 50 μm.
(L) Flow cytometry of S-Tn and ST6 in induced pluripotent stem cell (iPSC)-generated intestinal organoids from Pt 1, Pt 2, and HDs after 5 days of culture in GC-inducing conditions. Statistics for S-Tn MFI shown in right panel.
(M) Flow cytometry of S-T n and HA (ST6-HA) in iPSC-generated intestinal organoids from Pts 1 and 2 after transducing with EV and ST6-HA lentivirus. (Right) Statistics for S-Tn MFI. Data represent 3 experiments (A-G, I-M). Error bars represent the SD of samples within a group. *, p < 0.05; **, p < 0.01; ***, p < 0.001.
See also Figure S4.

