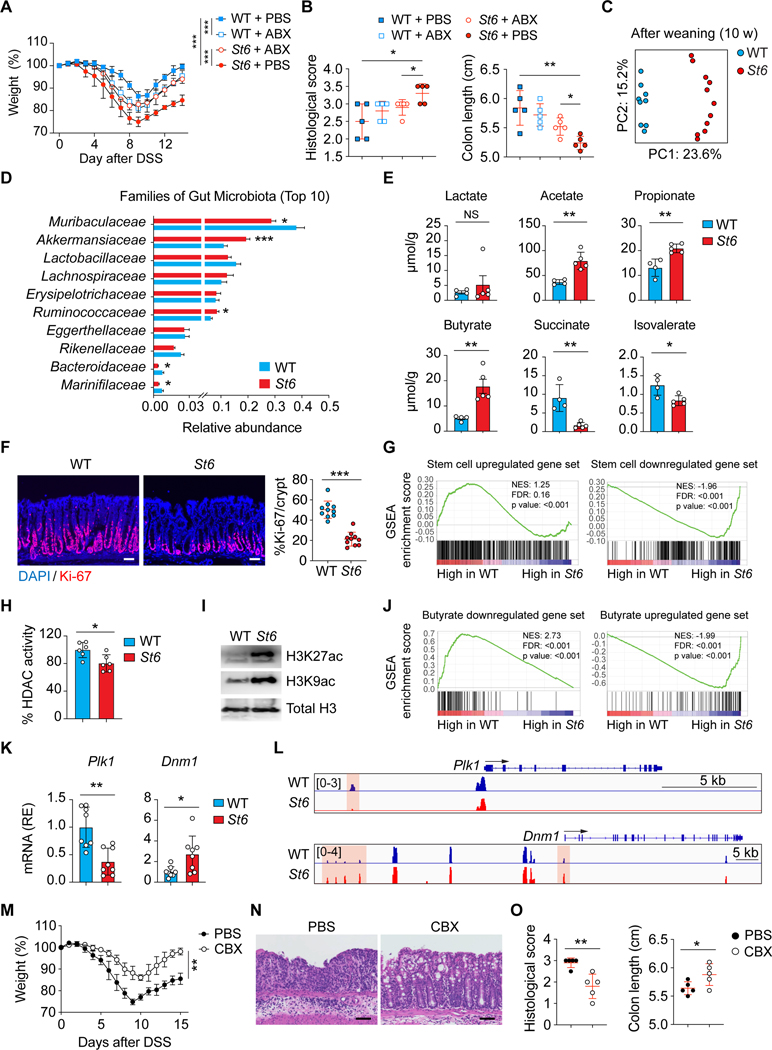
Figure 7. Microbiota changes and excess butyric acid production in St6 mice impairs ISC proliferation.
(A, B) DSS colitis was induced in 10-week-old female WT and St6 mice treated with or without antibiotics (ABX) and analyzed as in Figures 6D and 6F.
(C) Principal component analyses (PCA) of gut microbiome using 16S rDNA gene sequencing from WT and St6 female mice after weaning (10 weeks). Dots = individual mice.
(C) Ten most abundant (Top 10) gut bacterial families in 10-week-old female WT and St6 mice.
(E) Mass spectrometry analysis of SCFAs as indicated in stool samples from 10-week-old WT and St6 female mice.
(F) DAPI and Ki-67 staining of colon of WT and St6 mice 10 days after DSS colitis (left) and % Ki-67+ cells (right). Scale bar, 100 μm.
(G) Gene set enrichment analysis (GSEA) of murine intestinal crypt stem cell upregulated (left) and downregulated (right) genes from RNA-seq data in Habowski et al., 2020 were compared in WT and St6 mice as in (F). NES = normalized enrichment score. FDR = false discovery rate.
(H) Enzyme-based fluorometric assay of HDAC enzyme activity in purified crypt intestinal stem cells (ISCs) from WT and St6 mice as in (F).
(I) WB analysis of histone H3 acetylation (H3K27ac and H3K9ac) in ISCs from WT and St6 mice as in (F). Total histone H3 = loading control.
(J) GSEA as in (G) of butyrate downregulated (left) and upregulated (right) genes from data in Kaiko et al., 2016 were compared in WT and St6 mice as in (F).
(K) Q-PCR RNA analyses of Polo-like kinase 1 (Plk1) and Dynamin 1 (Dmn1) in samples of crypt ISCs of WT and St6 mice as in (F).
(L) Normalized ATAC-seq sequencing tracks from WT and St6 mice as in (F) at the Plk1 (top) and the Dmn1 (bottom) loci. Orange shows areas of significant difference.
(M-O) DSS colitis induced in St6 mice treated with either PBS or carbenoxolone (CBX) analyzed as in Figures 6D–6F. Scale bar, 100 μm. Data represent 3 experiments (A-F, H, I, K-O). Error bars represent the SD of samples within a group. *, p < 0.05; **, p < 0.01.
See also Figure S6.

