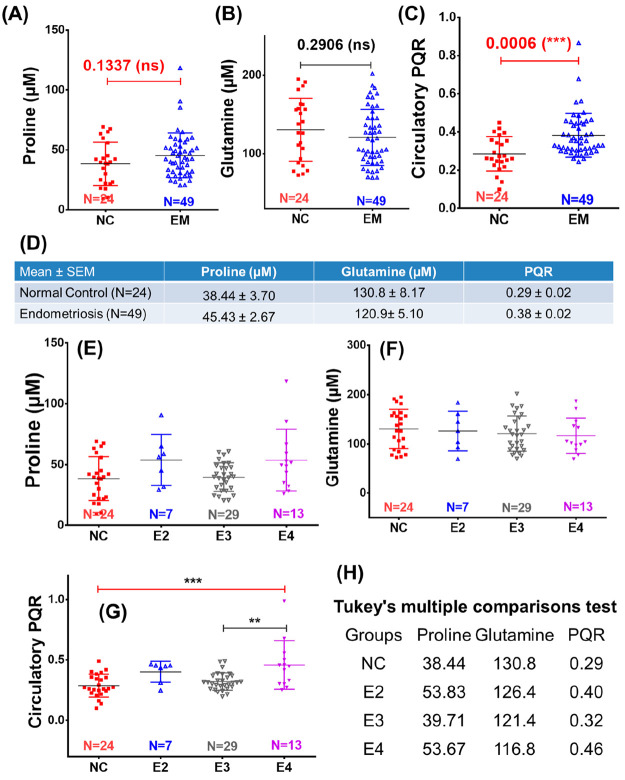
Figure 4.
(A–C) Box plots showing a comparison of the circulatory (A) proline and (B) glutamine levels and (C) proline to glutamine ratio (PQR) between endometriosis (EM) patients and normal control (NC) subjects. (D) Mean values (with standard error of mean (SEM)) of these circulatory parameters (i.e., proline, glutamine, and PQR) in EM patients and NC subjects shown in tabulated form. (E–G) Box plots showing a comparison of the circulatory (E) proline and (F) glutamine levels and (G) proline to glutamine (PQR) ratio between stage II, III, and IV endometriosis patients (E2, E3, and E4, respectively) with respect to normal control (NC) subjects. (H) Mean values of these circulatory parameters (i.e., proline, glutamine, and PQR) in NC subjects and E2, E3, and E4 patients shown in tabulated form. For each box plot, the boxes denote interquartile ranges, the horizontal line inside the box denotes the median, and the bottom and top boundaries of the boxes are the 25th and 75th percentiles, respectively. Lower and upper whiskers are 5th and 95th percentiles, respectively. Note: the NMR spectral data used for cross-validation purpose corresponds to that used in the previous plasma based clinical metabolomics study by Vicente-Muñoz et al.39

