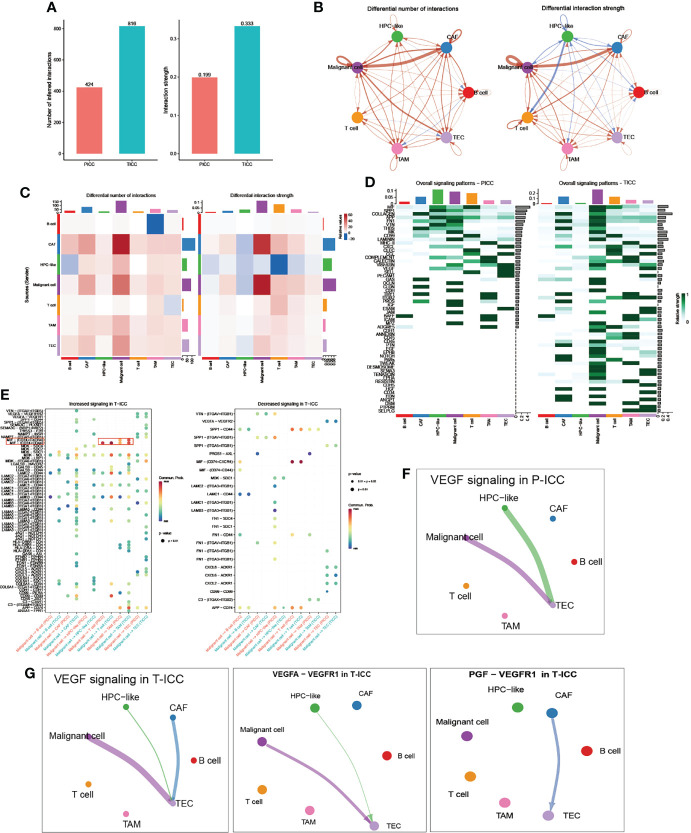
Figure 2.
Comparison of cellular interactions between P-ICC and T-ICC. (A) Bar plots displaying the sum of number (left) and weights (right) of ligand–receptor interactions between P-ICC and T-ICC. Circle plots (B) and heatmap (C) showing the differential number (left) and strength (right) of ligand–receptor interactions between distinct cellular components. Clusters are distinguished by colors. Red connecting lines indicated upregulated number or strength. The blue lines indicated reduced number or strength. (D) Heatmap showing the differential overall signaling patterns of cell types in P-ICC and T-ICC. (E) Dot plots showing the increased (left) and decreased (right) signaling effects of malignant cells on other cell types, respectively. Circle plots showing the VEGF-related signaling networks in P-ICC (F) and T-ICC (G). P-ICC, primary ICC; T-ICC, ICB-treated ICC.

