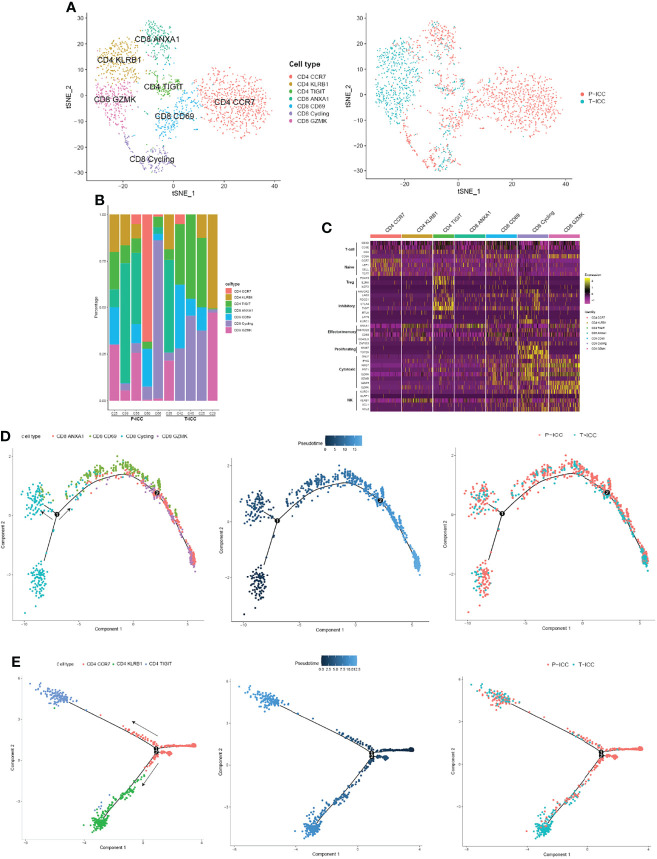
Figure 3.
Landscape of infiltrating T cells in P-ICC and T-ICC. (A) t-SNE projections of subclustered T cells, labeled in different colors, and T cell origins from P-ICC or T-ICC. (B) Bar plots showing the proportion of T-cell subtypes in each sample. (C) Heatmap indicating the expression of selected gene sets in T subtypes, including naïve, inhibitory, effector/memory, proliferating, cytotoxic, and cell type. Pseudotime analysis of CD8+ (D) and CD4+ T cells (E) from P-ICC and T-ICC. T-cell subtypes and origins are labeled by colors.

