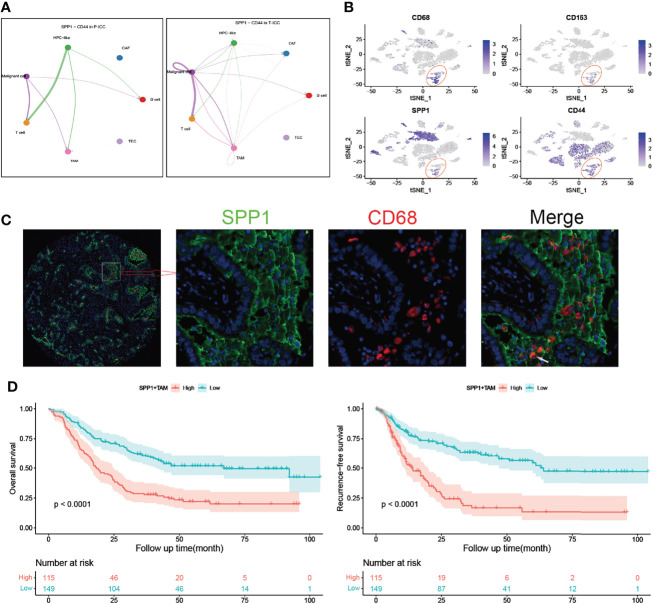
Figure 5.
SPP1+ TAMs correlate with poor prognosis in ICC. (A) Circle plots showing signaling networks of the ligand–receptor (SPP1-CD44) in P-ICC (left) and T-ICC (right). (B) t-SNE plots showing the CD68, CD163, SPP1, and CD44 expression levels in all cells of ICC samples. (C) Representative microphotographs of SPP1+CD68+ TAMs. White arrow indicates positive staining of SPP1 and CD68. (D) Kaplan–Meier survival curves for OS (left) and RFS (right) of patients with ICC grouped by infiltration levels of SPP1+ TAMs. P-values were determined via the log-rank test. OS, overall survival; RFS, recurrence-free survival; TAMs, tumor-associated macrophages.

