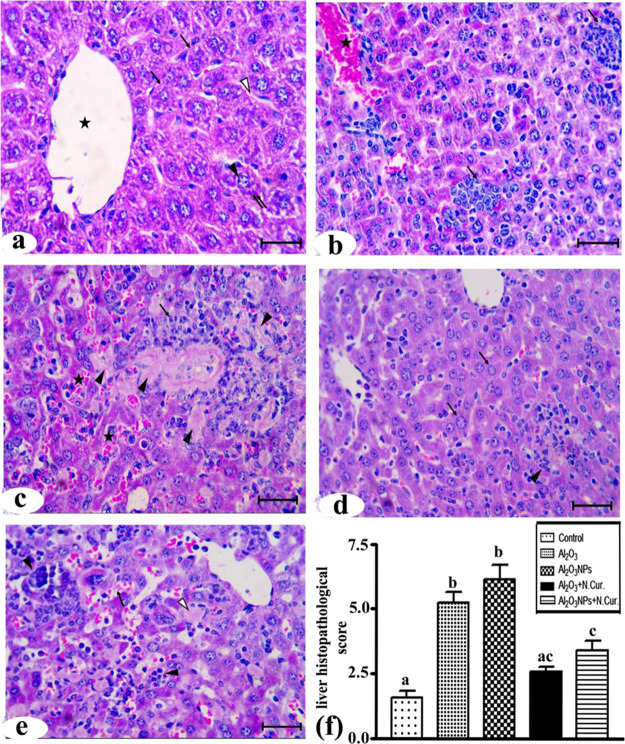
Figure 7.
Photomicrographs of liver sections stained by HandE. (a) Control group showing central vein (*), normal hepatocytes (↑) with vesicular nuclei (▲), basophilic clumps (↑↑), and blood sinusoids (Δ). (b) Al2O3 group showing: massive cellular infiltrations (↑) and highly congested central vein (*). (c) Al2O3-NP group showing areas of necrosis (▲), cellular infiltrations (↑), and congested blood sinusoids (*). (d) Al2O3 + N.Cur. group showing nearly normal hepatocytes (↑) and some cellular infiltrations (▲). (e) Al2O3-NP + N.Cur. group showing congested blood sinusoids (↑), cellular infiltrations (▲), and necrotic cells (Δ) (bar = 50 μm). (f) liver histopathology scores of groups.

