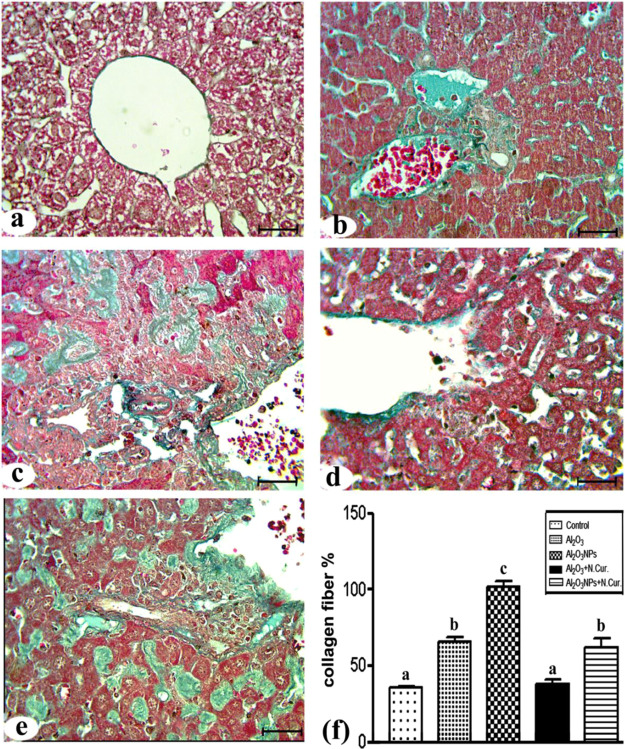
Figure 8.
Photomicrographs of liver sections stained with Masson’s trichrome stain. (a) Control group. (b) Al2O3 group showing an increase in the collagen fibers around central veins, sinusoids, and hepatocytes. (c) Al2O3-NP group showing a massive distribution of collagen fibers. (d) Al2O3 + N.Cur. group showing moderately distributed collagen fibers. (e) Al2O3-NP + N.Cur. group showing huge amounts of collagen fibers (bar = 50 μm). (f) The percentage of liver fibrosis.

