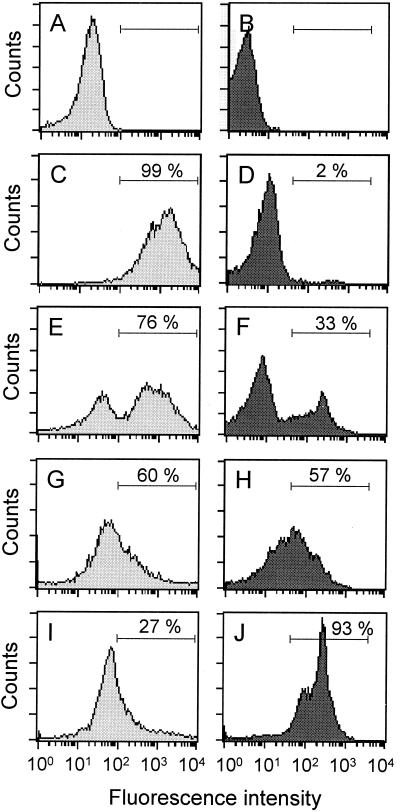
FIG. 2.
Histograms of GFP (A, C, E, G, and I) and PI (B, D, F, H, and J) fluorescence intensities of L. infantum p-229 promastigotes exposed to 5 μg of cycloheximide/ml (E and F), 50 μg of puromycin/ml (G and H), or 10 μM chloralin (I and J) for 24 h. The results for unstained control cells (A and B) and stained control cells (C and D) are also shown. A window was set (horizontal bars) to determine the proportions of GFP-and PI-positive cells, respectively, which are given as percentages.

