FIGURE 5.

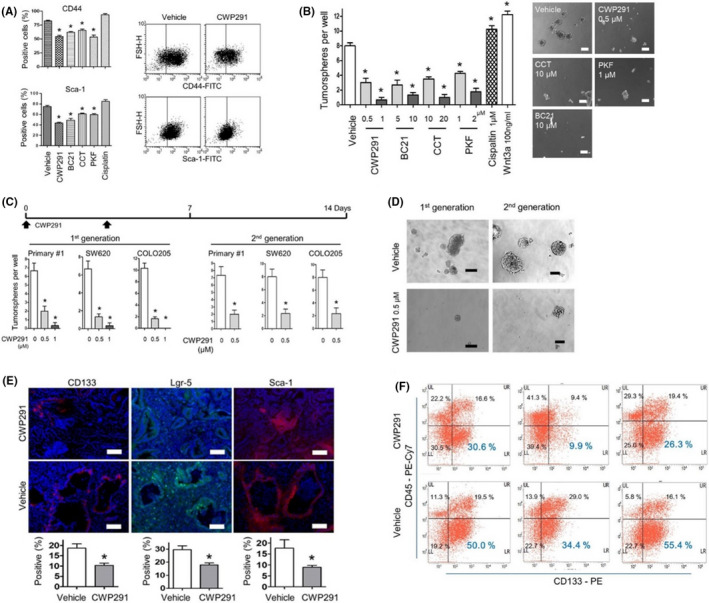
(A) FACS analysis for CD44 or Sca‐1‐positive subpopulations in primary #1 cells after Wnt small‐molecule inhibitors for 24 h. CWP291, 1 µM CWP232291; BC21, 10 µM BC21; CCT, 20 µM CCT031374; PKF, 2 µM PKF 118–774; Cisplatin, 1 µM cisplatin. Right, representative FACS images showing reduced CD44 or Sca‐1‐positive cells in primary #1 cells after CWP232291 treatment. (B) Sphere‐forming assay showing reduced tumorsphere formation from primary #1 cells after the treatment for 7 days with Wnt inhibitors. The spheres greater than 100 mm of diameter were enumerated. Right, representative images of tumor spheres after the treatment with Wnt inhibitors. (C) CWP232291 inhibited primary (with CWP232291) and second sphere formation (without CWP232291) in primary #1 and SW620. (D) Representative images of tumorspheres from primary #1 cells of (C). (E) Representative IF images for CD133, Lgr‐5, and Sca‐1, putative mouse intestinal cancer stem cell markers, in vehicle‐ or CWP232291‐treated allografts of SCID mice. SCID mice injected with primary #1 cell were treated with 100 mg/kg CWP232291 twice a week for 8 weeks. Bottom, IF scoring for CD133, Lgr‐5, and Sca‐1‐positive tumor cells in vehicle‐ (n = 3) or CWP232291‐treated (n = 3) allografts. Bar = 100 µm. (F) FACS analysis for CD133 in CWP232291‐ or vehicle‐treated allografts. Single cell suspensions were obtained from allografts after dispase digestion. FACS, fluorescence‐activated cell sorting; IF, immunofluorescence. *p < 0.05
