FIGURE 6.

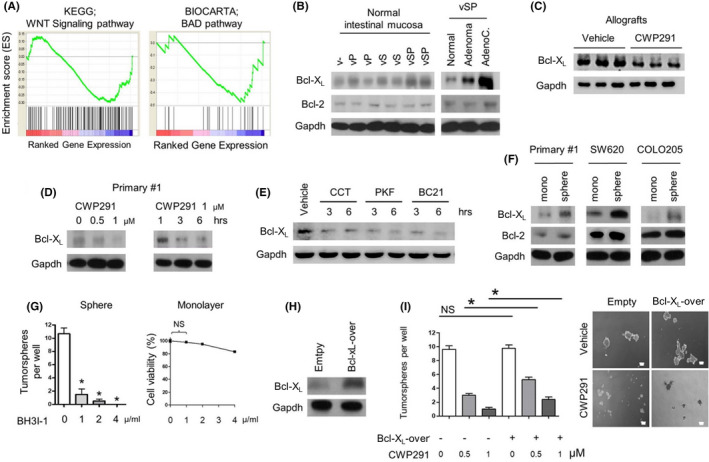
Downregulation of Bcl‐XL after Wnt inhibition in intestinal cancer cells. (A) The downregulation of Wnt and BAD signaling pathway in CWP232291‐treated allografts (n = 2) and vehicle‐treated allografts (n = 2) using GSEA based on mouse gene expression microarray analysis. Either 150 mg/kg of CWP232291 or vehicle was administered to SCID mice biweekly for 8 weeks after subcutaneous injection of 1 × 10⁶ primary #1 cells. (B) Western blot analysis for Bcl‐XL and Bcl‐2 in normal intestinal mucosa from each genotype and Villin‐Cre; Smad4F / F ; Trp53F / F primary intestinal tumors. vSP, Villin‐Cre; Smad4F / F ; Trp53F / F . vS, Villin‐Cre; Smad4F / F . vP, Villin‐Cre; Trp53F / F . AdenoC, adenocarcinoma. (C) Western blot analysis for Bcl‐XL expression in CWP232291‐treated allografts (n = 3) and vehicle‐treated allografts (n = 3). (D) Reduced Bcl‐XL expression in CWP232291‐treated primary #1 cells dose‐ and time‐dependently based on western blot analysis. (E) Reduced Bcl‐XL expression in primary #1 cells after treatment with Wnt small‐molecule inhibitors based on western blot analysis. CCT, 20 µM CCT031374. PKF, 2 µM PKF 118–310. BC21, 10 µM BC21. (F) Western blot analysis for Bcl‐XL and Bcl‐2 in monolayer and sphere cultures of primary #1, SW620, and COLO205 cells. (G) Sphere‐forming assay showing reduced tumorsphere formation after treatment of primary #1 cells with BH3I‐1, a Bcl‐XL antagonist at a dose‐dependent manner. Right, the growth inhibitory effect of BH3I‐1 on monolayer culture of primary #1 cells was measured by MTT assay. (H) Bcl‐XL overexpression in primary #1 cells as confirmed by western blot analysis. (I) Sphere‐forming assay in Bcl‐XL‐overexpressing primary #1 cells after CWP232291 treatment. Representative images for sphere‐forming assay were shown in the right. GSEA, gene set enrichment analysis; NS, No significance. *p < 0.05
