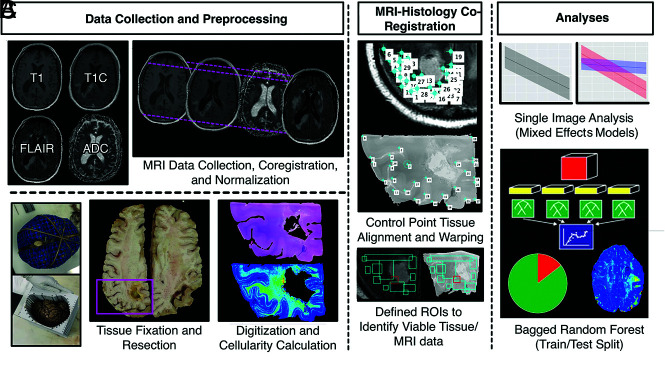
FIG 1.
Overview of the data-collection process. A, MR imaging data are collected from the patient’s final imaging session before death and coregistered, and T1, T1C, and FLAIR images are intensity-normalized. Tissue fixation and sampling involve the use of 3D printed brain cages and slicing jigs to preserve structural integrity relative to the MR imaging. Following staining, tissue samples are digitized for cellularity calculation using an automated nuclei segmentation algorithm. B, In-house software is used to align each tissue sample to the FLAIR image using manually defined control points and ROIs. C, Single-image cellularity associations are computed using mixed-effects models, and a bagging regression ensemble is trained to predict cellularity using 5 × 5 voxel tiles from each image using a two-thirds to one-third train-test split.

