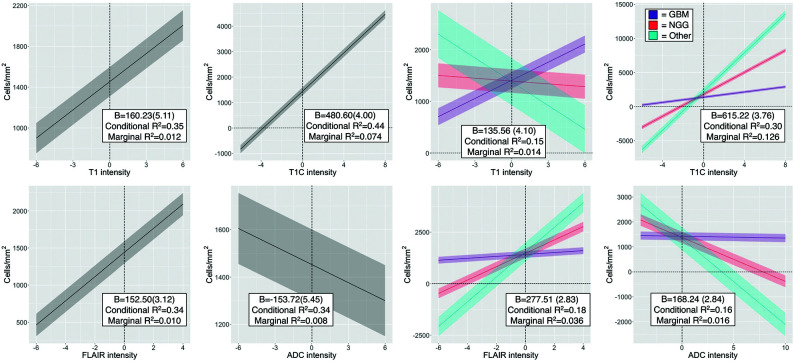
FIG 2.
Single-image results depicting the relationship between image intensity and cellularity for each contrast. β values for the left-handed plots indicate the change in cellularity per SD increase in image intensity and indicate positive associations for T1, T1C, and FLAIR, with the expected negative association between ADC and cellularity present. β values for the right-handed plots indicate the difference in slope among patients with GBM and NGG and Other patients, indicating that patients with GBM show less pronounced cellularity associations than patients with NGG across all image types, with the exception of T1 intensity.

