
FIG 1.
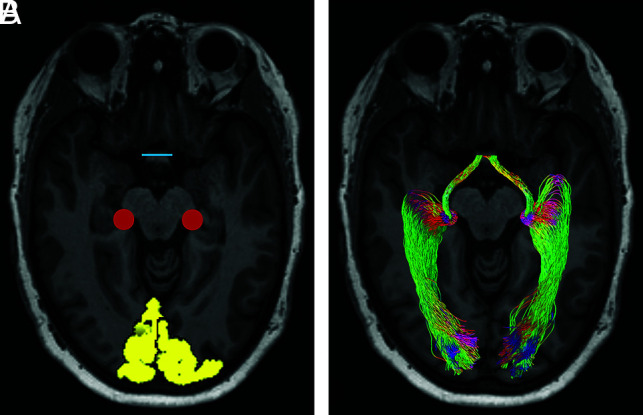
A representative example of visual pathway tractography. A, ROI placement overlaid on an axial section of a T1-weighted image. Yellow indicates V1 masks; red, representation of the LGN spherical ROI; blue, the optic chiasm. B, Probabilistic OT and OR fiber tracts. Red indicates transverse fibers; green, anterior-posterior fibers; blue, craniocaudal fibers.