. 2018 Nov 5;8(65):37117–37128. doi: 10.1039/c8ra06345a

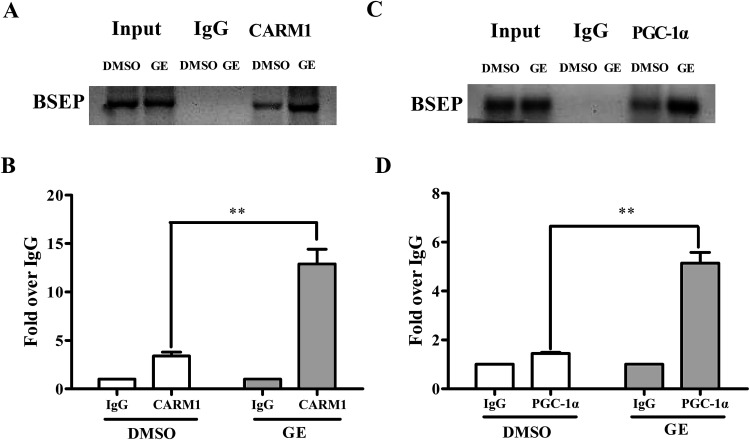
Fig. 7. ChIP analysis of HepG2 cells showed recruitment of CARM1 and PGC-1α at the BSEP promoter locus. Chromatins were prepared from HepG2 cells after treatment of DMSO (0.1%) or GE (100 μM), followed by immunoprecipitation with antibodies against CARM1 or PGC-1α. IgG was used as negative control. The results presented in (A) and (C) were derived from regular PCR using the BSEP primer that includes the FXR binding site. The data with qRT-PCR analysis in (B) and (D) quantitation of ChIP signal with a primer set flanking the FXRE of the BSEP promoter. Values are plotted as fold relative to the signal obtained with IgG (n = 5). **P < 0.01, GE treatment compared with DMSO.

Fig. 7