
Figure 3.
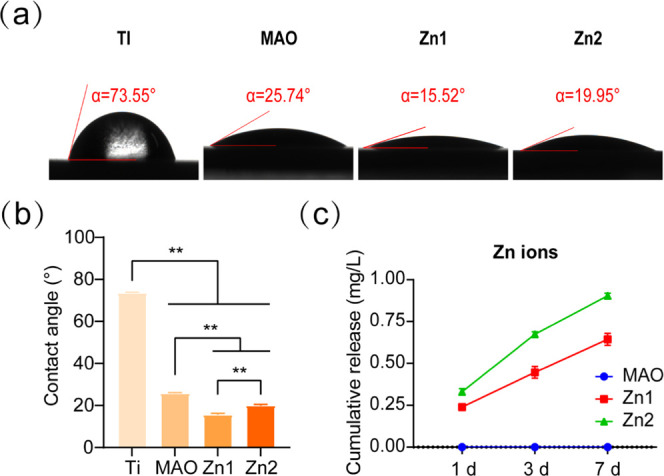
(a, b) Surface contact angles of Ti, MAO, Zn1, and Zn2. (c) ICP-OES examined the release of Zn2+ from the MAO, Zn1, and Zn2 groups on 1, 3, and 7 days. **P < 0.01, *P indicates significant difference between groups.
Official websites use .gov
A
.gov website belongs to an official
government organization in the United States.
Secure .gov websites use HTTPS
A lock (
) or https:// means you've safely
connected to the .gov website. Share sensitive
information only on official, secure websites.
(a, b) Surface contact angles of Ti, MAO, Zn1, and Zn2. (c) ICP-OES examined the release of Zn2+ from the MAO, Zn1, and Zn2 groups on 1, 3, and 7 days. **P < 0.01, *P indicates significant difference between groups.