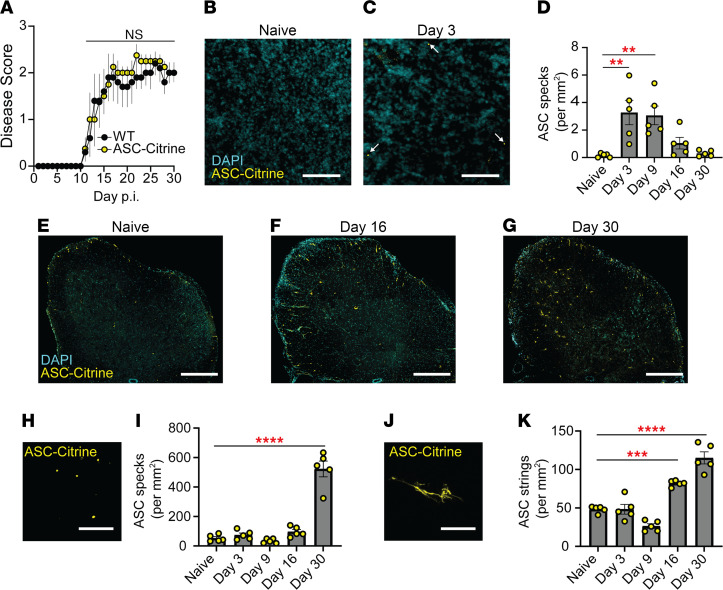
Figure 1. Inflammasome activation in the CNS during late EAE.
(A) EAE disease score of WT (n = 5) versus ASC-Citrine mice (n = 4). Mann-Whitney U test of total AUC for disease was used. Each data point represents a mean value among a group. (B–D) Representative images (B and C) and quantification (D) of ASC specks in the iLNs of ASC-Citrine mice during EAE. Each data point represents an average value from 2 cross sections of both iLNs (25 μm thickness) per mouse. n = 5 mice. One-way ANOVA, P = 0.0006, with Dunnett’s multiple comparisons test. Scale bar is 20 μm. (E–G) Representative images of SC from ASC-Citrine mice at indicated time points during EAE. Scale bar is 300 μm. (H–K) Representative images (H and J) and quantification (I and K) of ASC specks (H and I) and ASC strings (J and K) in SC from ASC-Citrine mice during EAE. Scale bar is 10 μm. Each data point represents a value from 1 mouse (n = 5). Two coronal cross sections (25 μm thickness) of L5 SC from 1 mouse were quantified manually and averaged. One-way ANOVA with Dunnett’s multiple comparisons tests (D, I, and K). **P < 0.01, ***P < 0.001, ****P < 0.0001. Error bars denote mean ± SEM (A, D, I, and K).

