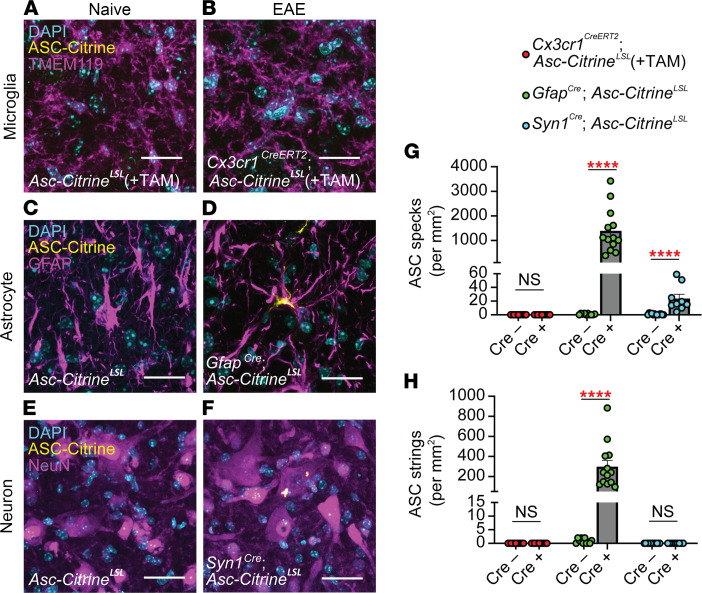
Figure 4. Identifying inflammasome activation in CNS cells by a mouse genetics approach.
(A–F) Representative images of SC in Asc-CitrineLSL versus Cx3cr1CreERT2 Asc-CitrineLSL mice (A and B), GfapCre/+ Asc-CitrineLSL mice (C and D), and Syn1Cre/+ Asc-CitrineLSL mice (E and F) at 30 dpi of EAE. Mice for microglia evaluation were treated with tamoxifen. Scale bar is 20 μm. (G and H) Quantification of ASC specks (G) and ASC strings (H) in SC VH of mice indicated in A–F. Each data point represents a value from 1 mouse. Combined from multiple experiments. (G and H) Mann-Whitney U test was used. ****P < 0.0001. Error bars denote mean ± SEM.

