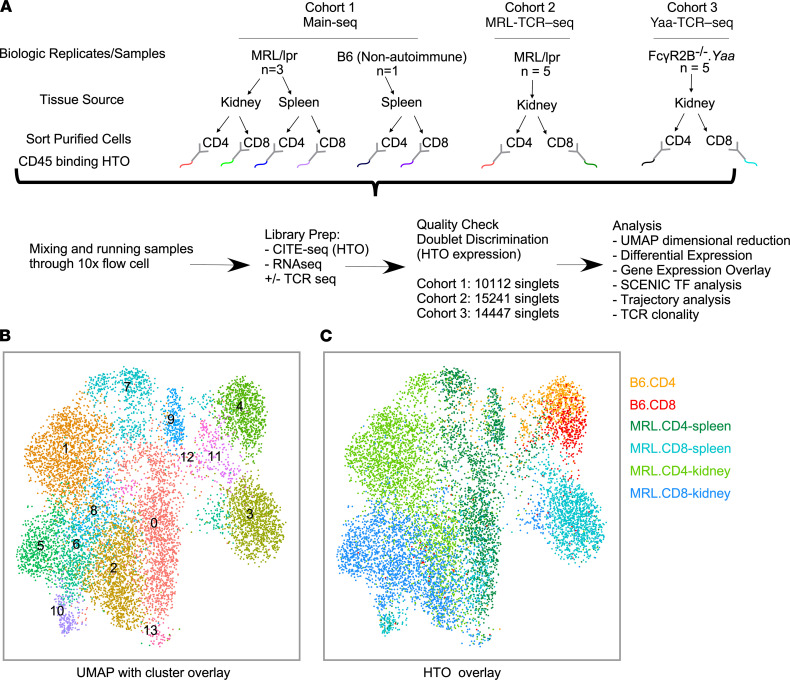
Figure 1. Low-resolution clustering of T cells from lupus-prone mice.
(A) Schematic of experimental design encompassing tissue source, sorting algorithm, marking with HTOs, number of mice used in each experimental cohort, and a description of downstream analytic techniques. (B) UMAP of T cells from mice in Main-Seq, outlining 14 clusters. (C) HTO-based assignment of cell source was mapped onto the UMAP. MRL/lpr, MRL.Faslpr; B6, C57BL/6; UMAP, uniform manifold approximation and projection; TF, transcription factor.

