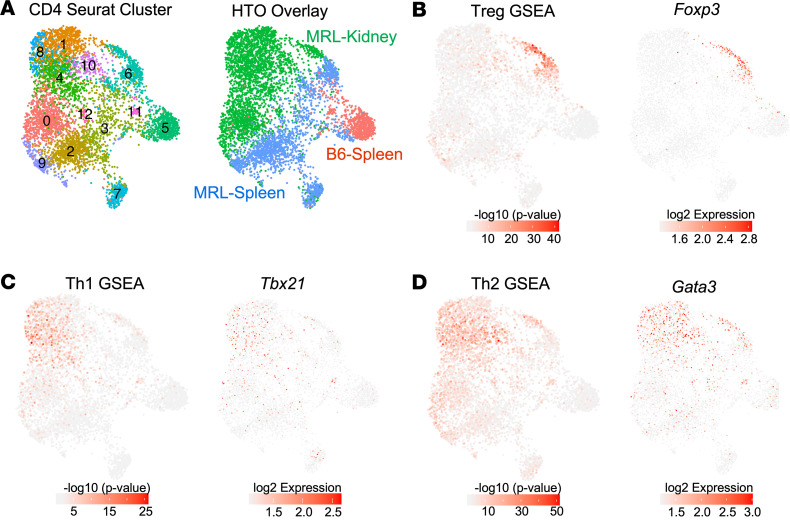
Figure 2. High-resolution clustering of CD4+ T cells uncovers unique transcriptional programs in KITs.
(A) UMAP of CD4+ T cells from Main-Seq outlining 13 clusters, with the right panel exhibiting assignment of cell source as determined by HTO. (B–D) Gene set enrichment analysis (GSEA) performed in each cell by Wilcoxon’s test (–log10 [P value]) using published reference gene signatures (Supplemental Table 1) and related TF expression were overlaid onto the UMAP to identify CD4 phenotypes. This included (B) Treg gene signature and Foxp3 expression, (C) Th1 signature and Tbx21/Tbet expression, and (D) Th2 signature and Gata3 expression.

