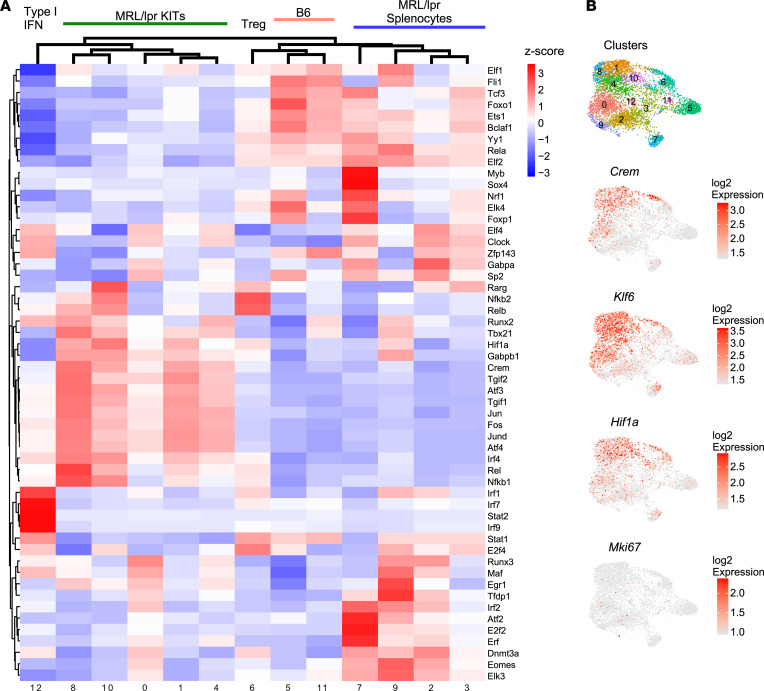
Figure 3. TF analysis suggests overarching transcriptional regulation of infiltrating CD4+ T cell clusters.
(A) Heatmap representing z-scored regulon activity of top TFs inferred by SCENIC and association with CD4+ T cell clusters. (B) Expression of selected TFs overlaid onto the CD4 UMAP as depicted in Figure 2.

