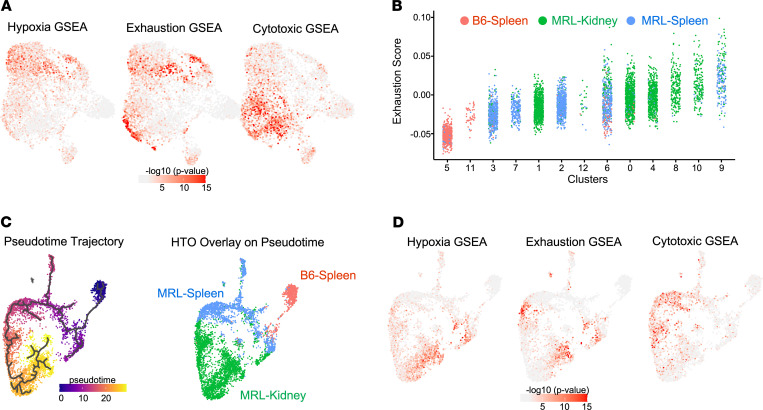
Figure 4. CD4+ KITs exhibit a progressive transcriptional phenotype from cytotoxicity to hypoxia/dysfunction through pseudotime.
GSEA performed in each cell by Wilcoxon’s test (–log10 [P value]) using published reference genes signature (Supplemental Table 1) overlaid onto the UMAP from Figure 2A. (A) Hypoxia signature, exhaustion signature, and cytotoxic CD4 signature. (B) Dot plots show the distribution of exhaustion score in each CD4+ T cell, grouped by cluster number. Dots are colored according to the source of cells they represent. Statistics were calculated by Kruskal-Wallis rank test. (C) Monocle trajectory mapping of CD4+ KITs wherein time 0 (dark purple) represents lineage origination with progression to most differentiated (yellow), with cell source mapping. (D) Gene signature mapping for the indicated signatures as defined in A.

