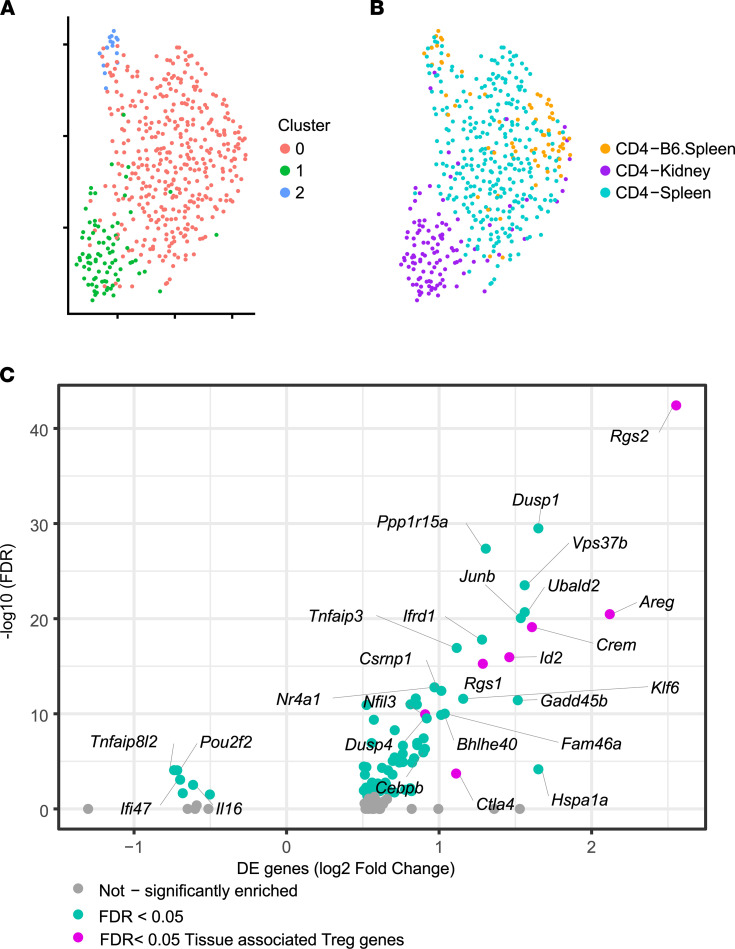
Figure 5. Kidney-infiltrating Tregs exhibit features of tissue reprogramming.
(A) High-resolution reclustering of Tregs identified as cluster 6 in Figure 2 (Main-Seq) identifies 3 unique clusters as illustrated by color-coding. (B) HTO-based identification of splenic (B6 and MRL/lpr) and KIT Tregs. (C) Volcano plot shows top significant (FDR < 0.05) DEGs that are upregulated or downregulated in KITs compared with splenic MRL/lpr Tregs, with genes in pink having been previously associated with tissue-resident Tregs (30).

