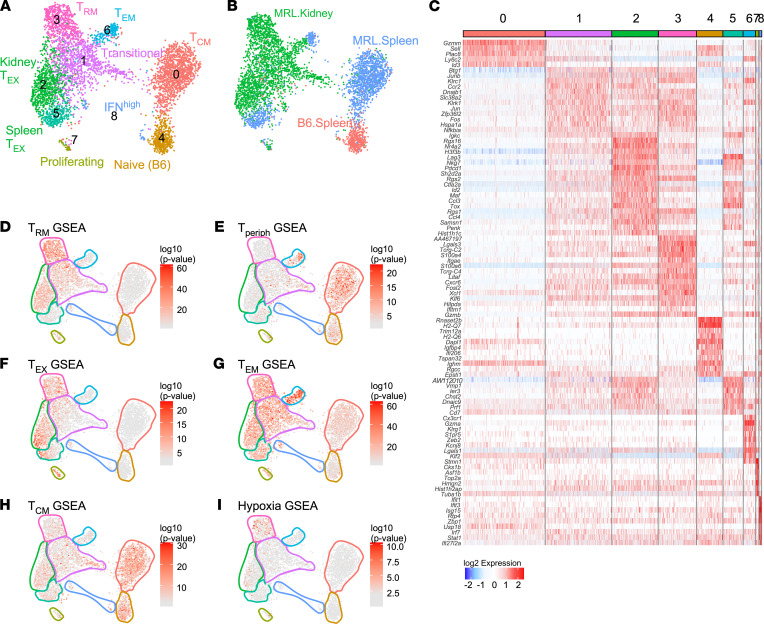
Figure 6. High-resolution clustering of CD8+ T cells identifies unique functional phenotypes.
(A) UMAP of CD8+ T cells from Main-Seq delineating 9 clusters. (B) UMAP with overlay exhibiting assignment of cell source as determined by HTO. (C) Heatmap shows top significant (FDR < 0.01) DEGs associated with each CD8+ cluster and their expression at single-cell level in columns. (D–I) GSEA performed in each cell by Wilcoxon’s test (–log10 [P value]) using published reference gene signatures (Supplemental Table 1), overlaid onto the UMAP to identify CD8 phenotypes. Clusters are outlined as per A. This included gene signatures for (D) resident memory (TRM), (E) circulating/lymphoid (Tperiph), (F) exhaustion (TEX), (G) effector memory (TEM), (H) central memory (TCM), and (I) hypoxia.

