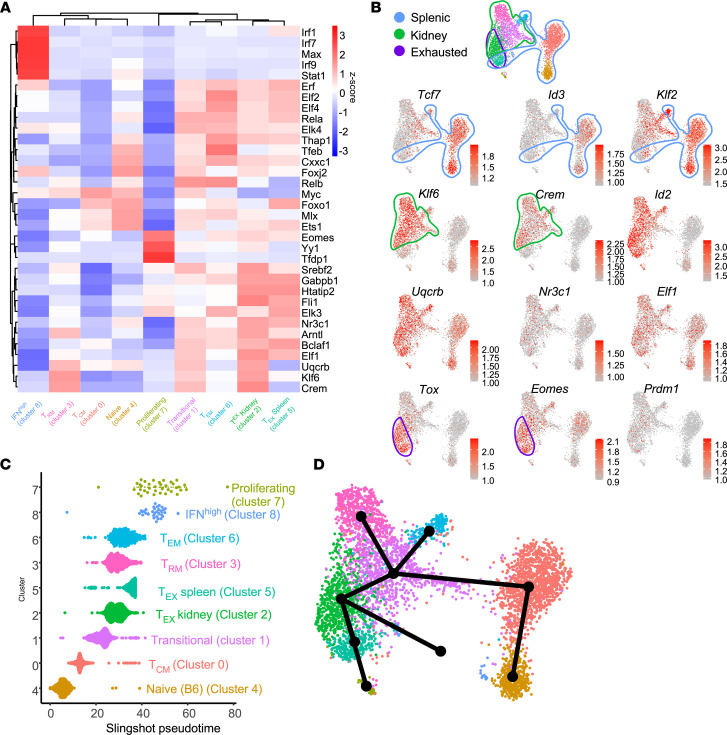
Figure 7. TF and lineage progression analysis of CD8+ KITs.
(A) Heatmap represents z-scored regulon activity of top TFs inferred by SCENIC (rows) and association with CD8+ T cell clusters (columns). (B) Representative TFs were mapped onto CD8 UMAPs; TF selection was based on known regulatory functions or due to identification via SCENIC analysis. Outlines highlight spleen-derived, kidney-infiltrating, and exhausted cells, with dot red color intensity representing log2 expression. (C) CD8+ T cells grouped into 9 distinct clusters and ordered by Slingshot pseudotime trajectory. (D) Slingshot lineage overlay on CD8+ T cell UMAP.

