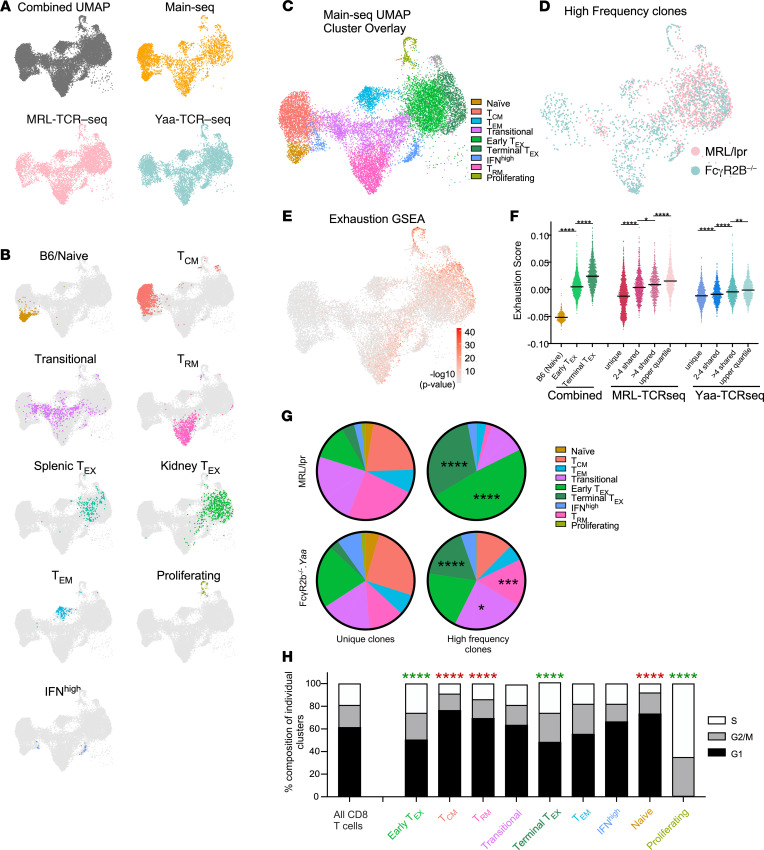
Figure 8. CD8+ KITs are clonally expanded, with clones and proliferation spanning the exhausted and transitional compartments.
(A) UMAP of all 3 scRNA-Seq cohorts (see Figure 1 for cohorts), integrated using Harmony, followed by projection of individual cohorts onto this “combined UMAP.” (B) Main-Seq–defined CD8+ clusters labeled by cluster name (Figure 6), mapped onto the combined UMAP. (C) Combined UMAP with all putative clusters as outlined in B. (D) High-frequency clones (defined as clones representing the top quartile of expressed TCRs) from each cohort are mapped onto the combined UMAP. (E) Exhaustion gene set enrichment calculated using Wilcoxon’s test overlaid onto the combined UMAP. (F) Dot plots represent exhaustion scores for cells grouped based on clonal frequency among MRL/lpr and FcγR2B–/–.Yaa KITs, with exhaustion scores for B6 naive, early TEX, and terminal TEX shown at left for reference (*P = 0.05, **P < 0.01, ****P < 0.0001 as determined by 1-way ANOVA with Tukey’s test for multiple comparisons). Horizontal bars represent medians. (G) Pie charts represent the relative cluster distribution of unique TCR T cells as compared with high-frequency TCRs from MRL/lpr (top) and FcγR2B–/–.Yaa (bottom) models with the relative distribution of these clones within the putative T cell clusters as defined in B and C. (H) Cell cycle state was assessed over all cells for each cluster using GSEA for genes indicative of G1, G2/M, and S phases. Proliferative potential was analyzed for enrichment of G2/M and S phase genes, comparing individual clusters with the total T cell population. (G and H) Data were analyzed using χ2 analysis and corrected for multiple comparisons for 9 comparison groups (*P = 0.05, ***P < 0.005, ****P < 0.0001). Green indicates enrichment of G2/M/S phase genes, and red indicates enrichment of G1 genes.

