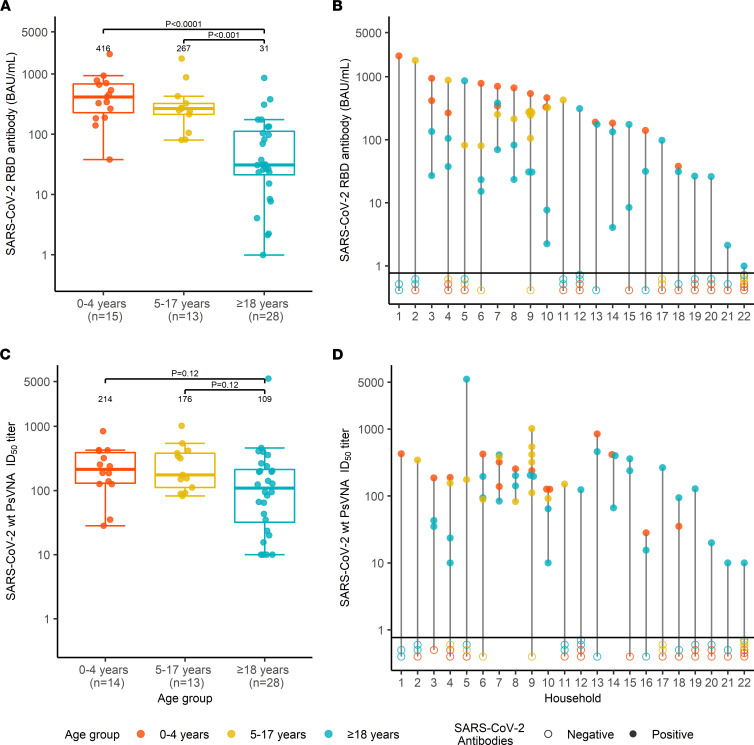
Figure 2. SARS-CoV-2 serum antibody titers at enrollment in SEARCh.
(A) Box-and-whiskers plot of SARS-CoV-2 RBDAb titers (BAU/mL) by age (orange, children 0–4 years; yellow, children 5–17 years; blue, adults). Bars indicate median values, box bounds represent IQRs, whiskers illustrate variability in relation to the IQR, and outliers are depicted beyond the whiskers. (B) RBDAb titers by household. Color scheme is the same as for A; filled circles represent RBDAb titers in seropositive individuals, and open circles represent RBD-seronegative household members not included in the analysis. The horizontal line distinguishes between the 2 groups. (C) WT SARS-CoV-2–neutralizing antibody ID50 titers measured by pseudotyped lentivirus reporter neutralization assay (PsVNA), shown and summarized by age group, as in Figure 1A. Samples with titers below the level of detection were assigned a value of 10. (D) PsVNA ID50 titers by household, using the sequence and color scheme shown for B. Statistical differences in antibody titers were compared using the 2-sided Mann-Whitney-Wilcoxon test. To adjust for 3 age group comparisons for each analysis in A and C, Bonferroni’s correction was applied, and the P value was multiplied by 2. One specimen from a child in the 0–4 year age group was not tested for neutralizing antibodies owing to insufficient sample volume.

