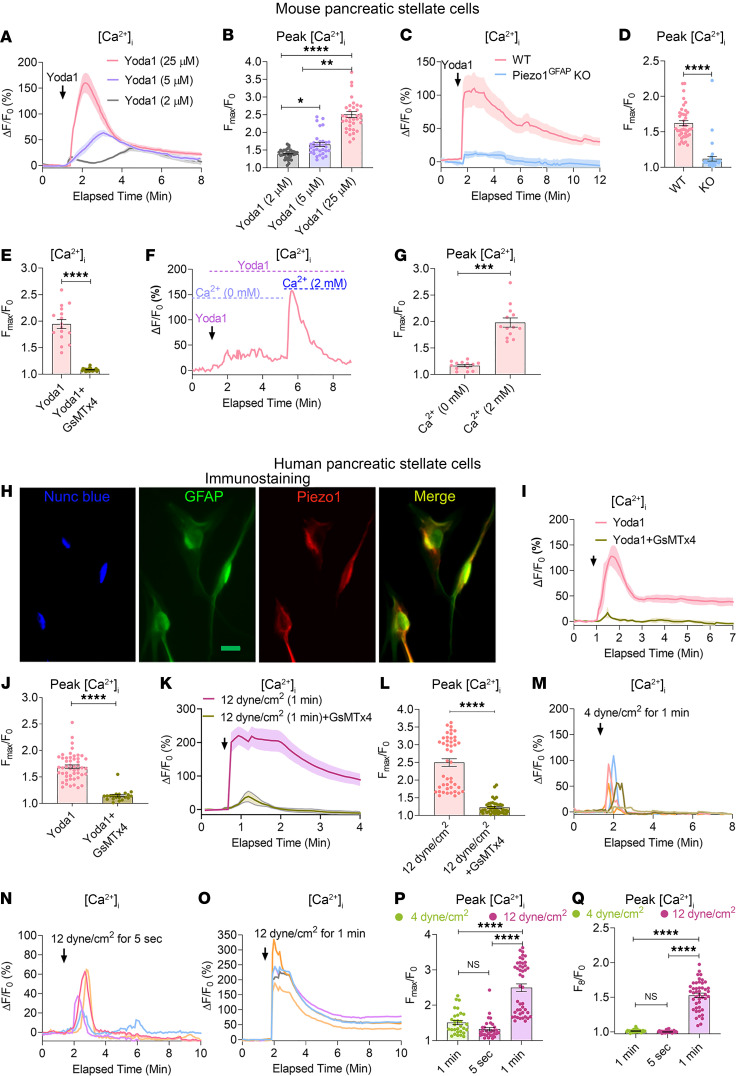
Figure 2. Functional expression of Piezo1 in pancreatic stellate cells.
(A and B) Tracing and graph illustrate the dose-dependent effects of the Piezo1 agonist, Yoda1, on [Ca2+]i in mouse PSCs (from 33 to 35 cells). The arrow represents the time of Yoda1 application. (C and D) Effects of Yoda1 (25 μM) on [Ca2+]i are shown in PSCs from WT and Piezo1GFAP-KO mice (from 40 cells). (E) Effects of Yoda1 on the rise in [Ca2+]i was blocked by the Piezo1 antagonist GsMTx4 (5 μM) (from 16 to 21 cells). (F and G) Yoda1 increased [Ca2+]i in the presence and absence of external calcium (from 13 cells). (H) Immunostaining of GFAP, nuclei (with Nunc blue), and Piezo1 in human PSCs. Merged images of GFAP (green) and Piezo1 (red) appear as yellow. (I and J) Yoda1-mediated [Ca2+]i rise in human PSCs was blocked with GsMTx4 (5 μM) (from 20 to 50 cells). (K and L) Tracing and graph represent the effects of fluid shear stress (12 dyne/cm2) applied for 1 minute on [Ca2+]i with or without GsMTx4 (5 μM) (from 41 to 45 cells). (M–O) Representative tracings show the effects of fluid shear stress applied at 4 dyne/cm2 for 1 minute, 12 dyne/cm2 for 5 seconds, and 12 dyne/cm2 for 1 minute on [Ca2+]i in human PSCs. (P and Q) Statistical comparisons of the peak and sustained [Ca2+]i rise for the fluid shear stresses shown in M–O (from 30 to 45 cells). The sustained elevation in [Ca2+]i was measured at 8 minutes of imaging. Data are presented as mean ± SEM. Statistical analyses were calculated using 2-tailed Student’s t test for 2 groups, and multiple groups were analyzed by 1-way ANOVA. *P ≤ 0.05; **P ≤ 0.01, ***P ≤ 0.001; ****P ≤ 0.0001. Scale bar: 10 μm.

