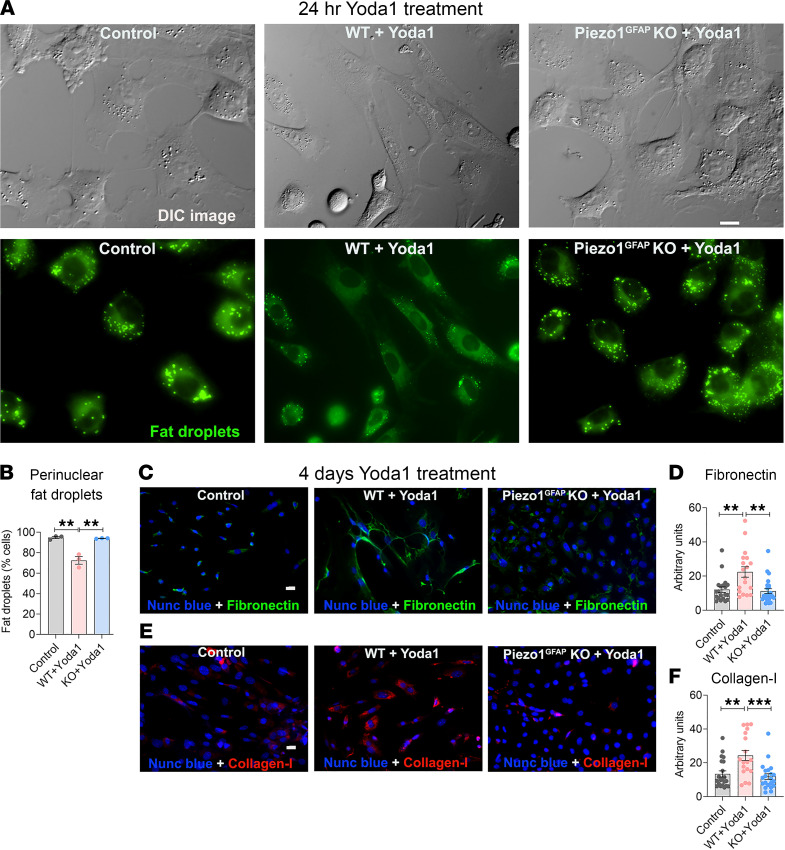
Figure 4. Yoda1 caused stellate cell activation and conversion to a fibroblast phenotype.
(A) DIC images and Bodipy 493/503–stained fat droplets (green) in WT and Piezo1GFAP-KO mouse PSCs without Yoda1 and 24 hours after Yoda1 (25 μM). The images were captured using MetaMorph 7.10.1 software from Molecular Devices. (B) Yoda1-induced loss of fat droplets (from 3 experiments; > 100 cells per experiment). (C and E) Representative images of fibronectin and collagen type I immunostaining in mouse PSCs 4 days after Yoda1 (25 μM) (representative of 3 experiments). (D and F) Quantification of the fibronectin and collagen type I intensity (arbitrary units) were calculated from data shown in C and E. Data are shown as mean ± SEM. Scale bars: 10 μm. Statistical analyses were calculated for multiple groups by 1-way ANOVA. **P ≤ 0.01, ***P ≤ 0.001.

