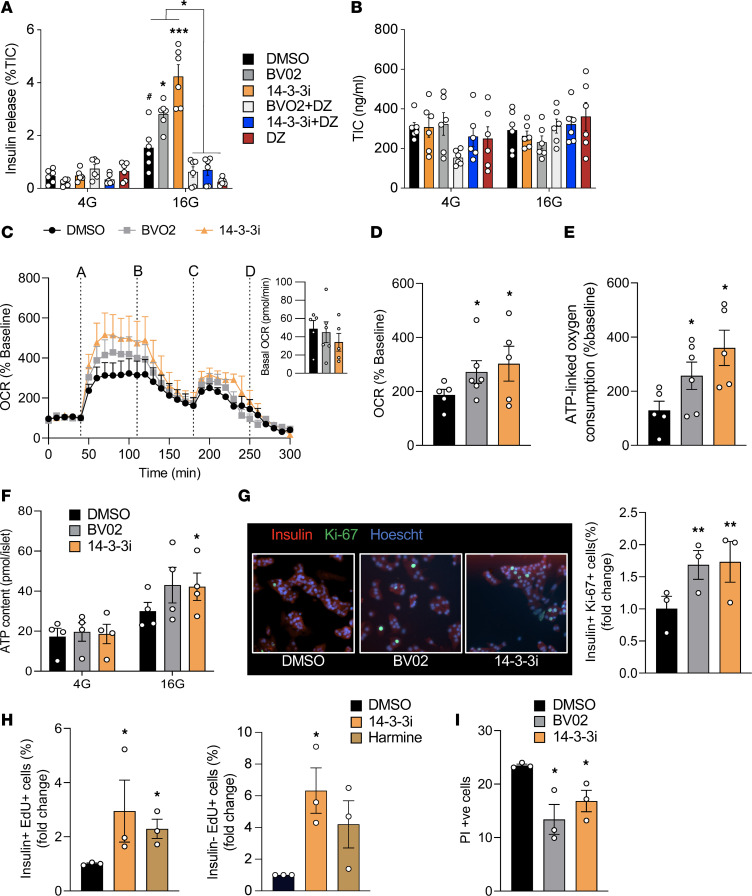
Figure 1. 14-3-3 Protein inhibition in mouse islets enhances insulin secretion, mitochondrial function, and proliferation.
(A and B) Mouse islets were incubated with 14-3-3 inhibitors (10 μM) and diazoxide (DZ, 200 μM) for 1 hour prior to 4 (4G) or 16 (16G) mM glucose for 1 hour. Insulin secretion was measured by radioimmunoassay (A) and normalized to total insulin content (B; n = mice 5–6 per group; #P < 0.05 versus DMSO 4G; *P < 0.05 and ***P < 0.001 versus DMSO 16G). (C) Combined OCR trace, with basal OCRs in the inset image, showing when islets were treated with (line A) 16 mM glucose, (line B) oligomycin (5 μM), (line C) FCCP (1 μM), and (line D) rotenone (5 μM) and antimycin (5 μM). (D and E) Glucose-induced OCR (D) and ATP-linked oxygen consumption (E) were measured (n = 5–6 mice per group; *P < 0.05 versus DMSO). (F) Biochemical ATP measurements in islets treated with 14-3-3 inhibitors (n = 4 mice per group; *P < 0.05). (G) In dispersed islets, β cell proliferation was measured by immunostaining for insulin+ and Ki-67+ β cells after 72-hour treatment with 14-3-3 inhibitors (n = 3 per group; *P < 0.05). (H) β Cell proliferation was quantified by flow cytometry–mediated detection of insulin+ and EdU+ β cells, following 72-hour treatment with 14-3-3i or harmine (10 μM each). Insulin– and EdU+ cells were also measured (n = 3 per group; *P < 0.05). (I) Cell death, defined by propidium iodide+ (PI, 0.5 μg/mL) and Hoechst 33342+ (50 ng/mL) cells, was measured in dispersed islets exposed to 14-3-3 inhibitors (10 μM each) for 72 hours (n = 3 per group; *P < 0.05). Significance was determined by 1-way ANOVA, followed by Dunnett’s test (C–E and G–I), or 2-way ANOVA, followed by Tukey’s test (A and F).

