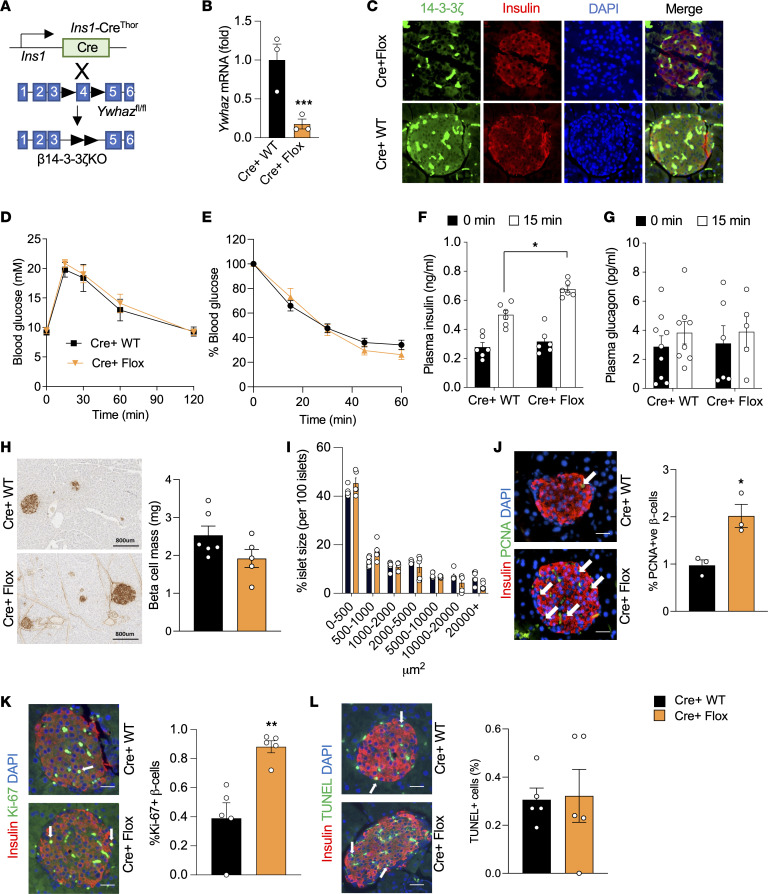
Figure 3. β Cell–specific deletion of 14-3-3ζ enhances glucose-induced insulin secretion in vivo and increases β cell proliferation.
(A) Generation of β cell–specific 14-3-3–KO mice (Cre+ Flox) was accomplished by breeding Ins1CreThor mice with mice harboring floxed alleles of Ywhaz. (B) Isolated mRNA from islets from Cre+ Flox mice and their littermate controls (Cre+ WT) were subjected to qPCR analysis for Ywhaz mRNA levels (n = 3 per genotype; ***P < 0.001) (C) Immunofluorescence staining for insulin and 14-3-3ζ on Cre+ WT and Cre+ Flox pancreatic sections (representative images of n = 3 mice per genotype). Magnification ×20. Scale bar = 100 μm. (D and E) No differences in glucose (D) or insulin (E) tolerance were observed in Cre+ Flox mice following i.p. injections of glucose (2 g/kg) or insulin (0.75 IU/kg), respectively (n = 5–9 mice per genotype). (F and G) Cre+ Flox mice displayed potentiated insulin secretion (F) following i.p. glucose (2 g/kg) injections, and no differences were observed in circulating glucagon (G) (n = 5–9 per genotype; *P < 0.05). (H and I) Pancreatic tissue from 12-week-old Cre+ WT and Cre+ Flox mice were collected, and β cell mass (H) and islet size distribution (I) were determined (n = 5–6 mice, 4 sections per mouse). Scale bar: 800 μm. (J and K) β Cell proliferation was measured by coimmunostaining for PCNA+ (J, n = 3 per genotype; *P < 0.05; scale bar: 100 μm) or Ki-67+ β cells (K, n = 3 per genotype; **P < 0.01; scale bar: 100 μm). White arrows denote positive cells. (L) TUNEL+ apoptotic β cells (white arrows) were measured in 4 pancreatic sections from Cre+ WT and Cre+ Flox mice. Scale bar: 100 μm. White arrows denote positive cells. Significance was determined by unpaired, 2-tailed Student’s t test (B, J, K, and L) or by 2-way ANOVA, followed by Tukey’s multiple-comparison test (F).

