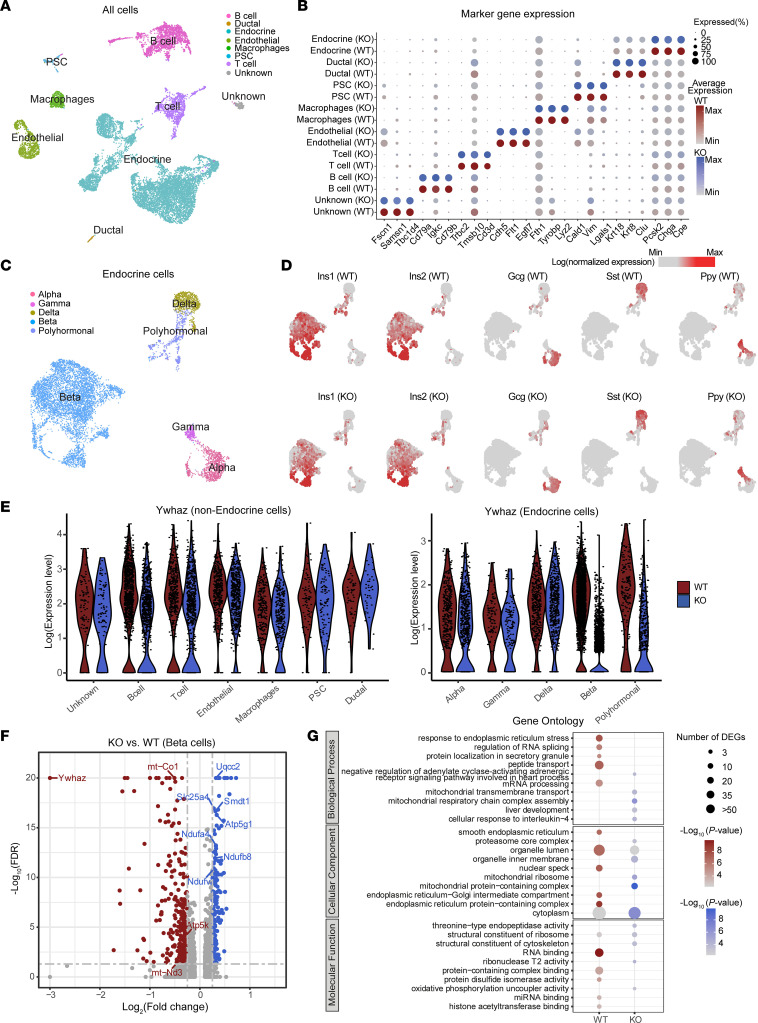
Figure 4. Single-cell transcriptome analyses of β14-3-3ζ–KO islets.
(A) UMAP plot of all cells from WT and KO mouse pancreas colored by cell type. (B) Dot plots of candidate marker genes specific for cell types. The size and the color of the dot encode the percentage of cells and average expression level across all cells within each group (red and blue represent high expression levels in WT and KO cells, respectively). (C) UMAP plot of all endocrine cells from WT and KO mouse pancreas colored by cell subtypes. (D) UMAP plot as in C but split into WT and KO cells, illustrating the expression of the 4 endocrine hormones (both mouse Ins1 and Ins2 will encode for mature insulin protein): Ins1, Ins2, Gcg, Sst, and Ppy. The color scale is according to log-transformed normalization values, with light gray and red corresponding to the minimum and maximum expression, respectively. (E) Violin plot showing the expression of Ywhaz in different types of cells. (F) Volcano plot of the distribution of genes with at least 0.1 difference in log2 fold change in expression level, mapping the 351 upregulated genes (blue) and 358 downregulated genes (red). –Log10 FDR > 20 was set to avoid extremely high values. (G) Dot plot showing enriched GO from genes highly expressed in WT and KO β cells, respectively. The size and the color of the dot encode the numbers of DEGs and the significance of corresponding enriched GO. Data are an aggregate of n = 3 WT and n = 3 β14-3-3ζ–KO mice per group.

