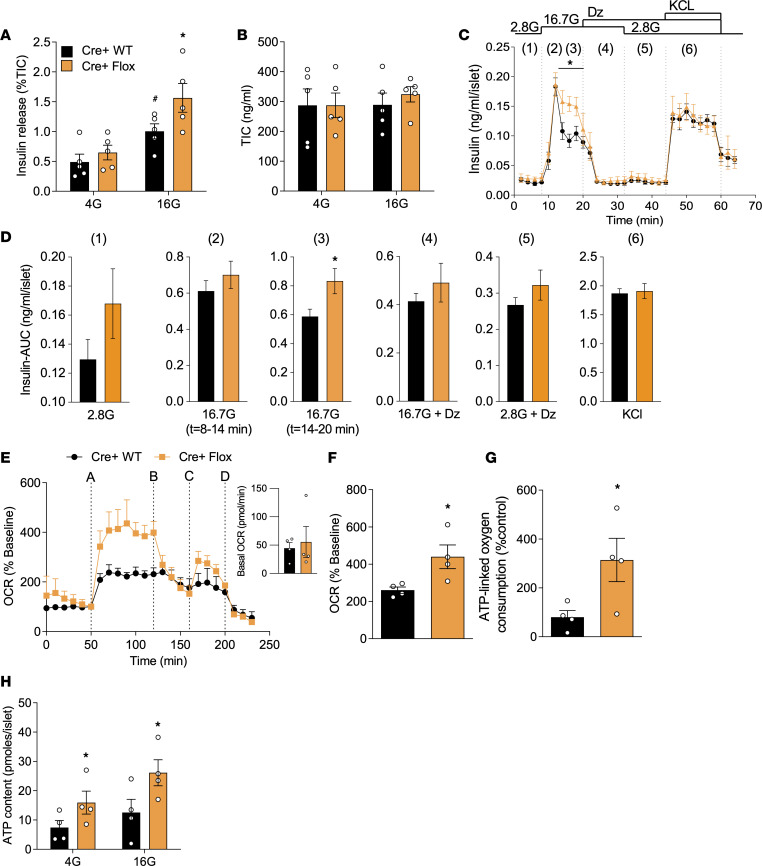
Figure 5. Enhanced β cell function ex vivo in β cell–specific 14-3-3ζ–KO mouse islets.
(A) Isolated islets from Cre+ WT and Cre+ Flox mice were subjected to static glucose-stimulated insulin secretion assays. (B) Quantification of insulin content in acid-ethanol extracts from Cre+ WT and Cre+ Flox islets (n = 5 mice per group). (C and D) Perifusion of islets from 14-week-old Cre+ WT and Cre+ Flox mice was performed to examine insulin secretion dynamics in response to (lane 1) 2.8 mM glucose, (lanes 2 and 3) 16.7 mM glucose, (lane 4) 16.7 mM glucose + 200μM diazoxide, (lane 5) 2.8 mM glucose + 200μM diazoxide, or (lane 6) 35 mM KCl (C) and the corresponding AUCs (D) to each interval are shown (n = 3 mice per group). (E–G) Mitochondrial function, as determined by OCR (E and F) and ATP-linked oxygen consumption (G) were measured in Cre+ WT and Cre+ Flox islets. The inset image shows average basal OCR from 0 to 50 minutes. For OCR trace: (line A) glucose (16 mM); (line B) oligomycin (5 μM); (line C) FCCP (1 μM); and (line D) rotenone/antimycin (5 μM). (H) ATP content in islets from Cre+ WT and Cre+ Flox mice was quantified following exposure to different glucose concentrations (n = 4 per genotype) (*P < 0.05 when compared with Cre+ WT). Significance was determined by unpaired, 2-tailed Student’s t test (C, D, F, and G) or by 2-way ANOVA, followed by Tukey’s multiple-comparison tests (A and H).

