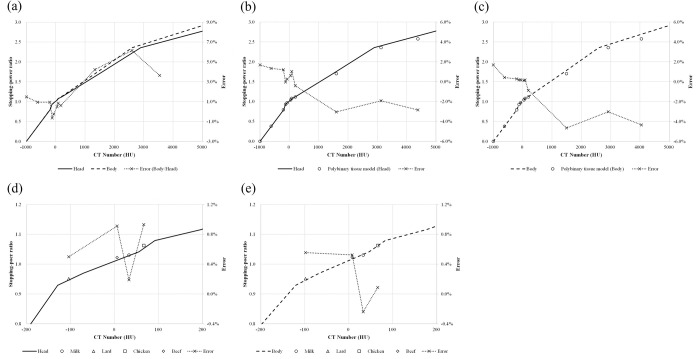
Fig 1. CT number-to-RSP curve created with stoichiometric calibration.
(a) Relationship between head and body cancer cases—solid lines: head case; dashed lines: body case; dotted lines with crosses: errors. Comparison of curves obtained using our method and using a polybinary tissue model for (b) head and (c) body; the circles show the polybinary tissue model. Comparison between the calculated stopping-power ratio and those measured for materials representing (d) head and (e) body—circles: milk; triangles: lard; squares: chicken; diamonds: beef.

