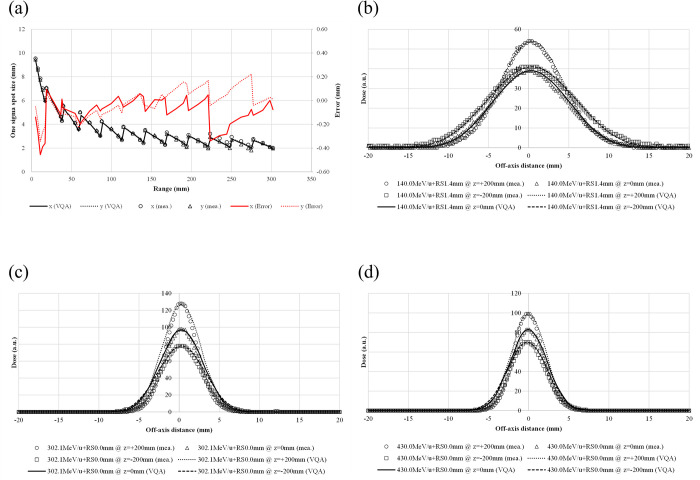
Fig 2. In-air spot sizes and profiles for selected energies.
(a) The beam size defined by one sigma in the isocenter plane (z = 0) vs. energy—solid line: calculated spot size in the x-direction; dotted line: calculated spot size in the y-direction; circles: measured spot size in the x-direction; triangles: calculated spot size in the y-direction; red solid line: error in the spot size in the x-direction; red dotted line: error in the spot size in the y-direction. The lateral in-air dose profiles are shown for a pencil beam at selected energies and different positions. The selected energies are (b) 140.0 MeV/u, (c) 302.1 MeV/u, and (d) 430.0 MeV/u. The lateral in-air dose profiles are measured at z = +200 mm (circles), 0 mm (triangles), and −200 mm (squares), whereas they are calculated at z = +200 mm (dotted lines), 0 mm (solid lines), and −200 mm (dashed lines).

