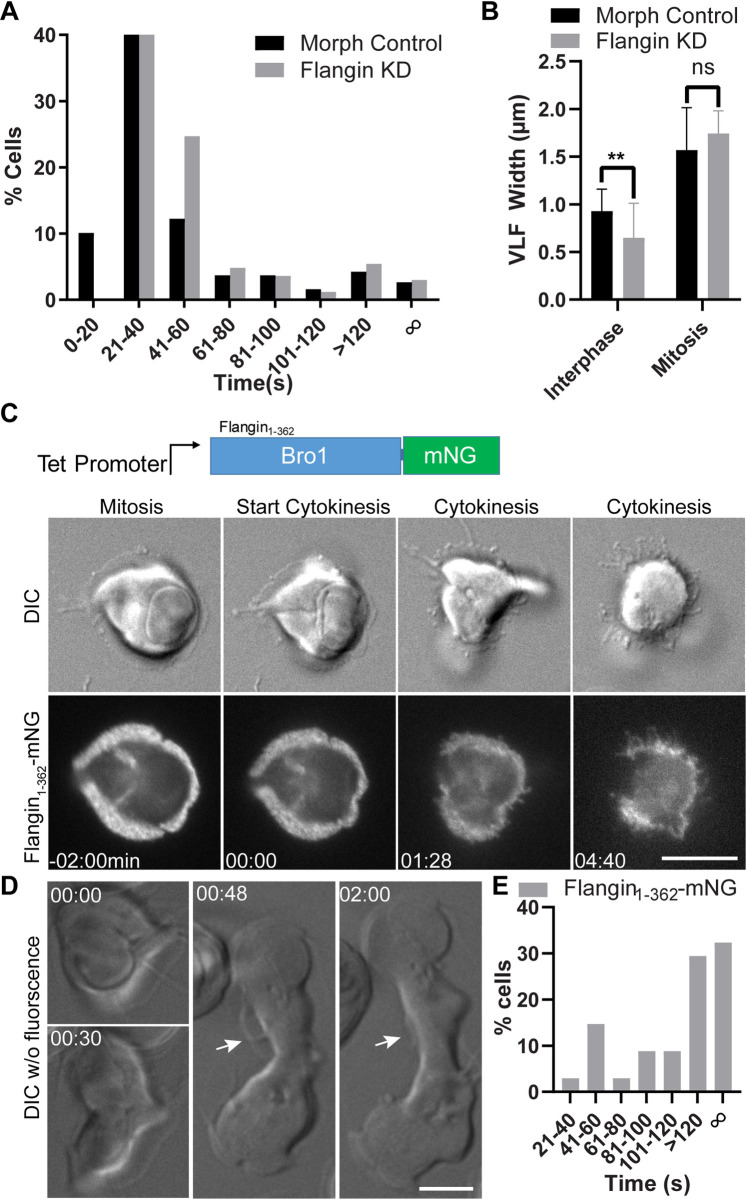
Fig 4. Flange breakdown is necessary for cleavage furrow progression.
(A) Histogram showing the timing of cytokinesis for morpholino control (black) and Flangin KD cells (gray). See S4 and S5 Movies. Cytokinesis median time: control 31 sec (n = 188) and Flangin KD 35 sec (n = 166). Due to sampling frequency (timing between image stacks) the difference in median values in this experiment is not meaningful, similar to our previous study, more than 90% of the cells in both groups complete cytokinesis by 120 seconds indicating that there is no cytokinesis defect. (B) Flangin KD cells grow their flange before cytokinesis similar to control cells (See S5 Movie). (C) A tet inducible N-terminal truncation of Flangin interferes with flange retraction during cytokinesis. This blocks furrow progression and the ability of the parasite to lift off the cover glass (Compare S1 and S6 Movies). (D) DIC imaging of the same cell line without fluorescence. This is an example of a moderate defect where the flange persists and cytokinesis took 8 minutes to complete (see S7 Movie). White arrow points to regions of the flange that should have been resorbed by this point in cytokinesis. (E) Cytokinesis timing for Flangin1-362-mNG filmed with DIC alone (n = 34), only 38.3% of cells completed cytokinesis within 120 seconds. Scale bar = 5 μm.

